

Confectionery products without cocoa content
Confectionery products without cocoa content include: chewing gum, licorice extract, white chocolate, tablets including sore throat lozenges, sugar-coated confectionery products, jelly products and jellies, boiled sweets including filled, toffee candies, caramels, confectionery products in the form of compressed tablets, and others, not mentioned above.
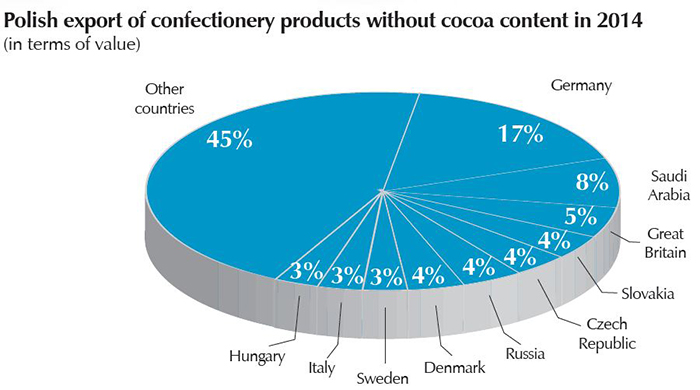
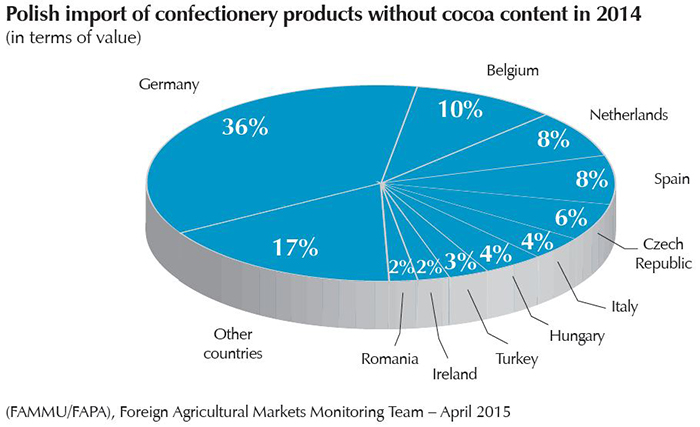
The volume of exports of confectionery products without cocoa content in 2014 increased by 10% to nearly 67.8 thousand tons. The value of exported goods increased slightly less dynamically, i.e. by above 9%, to nearly EUR 252.2 million (EUR 230.2 million in 2013). At the same time, nearly 49.9 thousand tons of these products (an increase by 8% from 46 thousand tons) were imported to Poland for EUR 152.3 million, which is 9% more in comparison with EUR 139.9 million in 2013. As a result, the positive account balance increased by 11% to EUR 99.8 million (in relation to EUR 90.3 million earlier). The volume showed a surplus of 17.9 thousand tons, and the balance increased by 16% from 15.4 thousand tons. The improvement of results in the foreign trade of confectionery products without cocoa content is a result of a slightly higher growth dynamics in export than import.
Chocolate products
As in the previous years, amongst the groups of goods analyzed in this chapter, chocolate products (confectionery products with chocolate content) were the most valuable item in Polish export and import of products in the sugar and confectionery industry. In 2014, the volumes of Polish foreign trade in these products ended with a positive balance amounting to EUR 611.2 million, constituting, however, a decrease year-over-year by more than 3% from EUR 633.1 million in 2013 (EUR 507.4 million in 2012). In terms of volume, the positive balance decreased even more dynamically, by 8% to 121.3 thousand tons (in comparison with 131.3 thousand tons the year before and 111.2 thousand tons in 2012). In previous years, the positive balance was growing year by year. The decrease thereof results from the limitation of exports to the UK, the main outlet for Polish chocolates.
In 2014, 248.7 thousand tons of these products were exported, for a value of EUR 1062.5 million (in 2013, 258.6 thousand for EUR 1067 million). The export volume was lower by 4%, and the export value dropped minimally, by 0.4%. At the same time, the import volume was stable at 127.4 thousand tons, but its value was higher by 4%, with an increase to EUR 451.3 million (127.3 thousand tons for EUR 433.9 million in 2013).
Stimulants – exports growing more dynamically than imports
Stimulants have an increasing significance in the Polish agricultural and food trade. 2014 brought another increase in the qualitative change which had been observed since 2009: the value of exports in the group of commodities under consideration exceeded imports to an even greater extent than the year before; moreover, the high growth dynamics of exports were accompanied by a significantly lower increase of imports, which translated into an increase of the positive balance of trade exchange of these products. In the previous year, stimulants worth nearly EUR 3.34 billion were sent abroad, resulting in a 21% increase in relation to 2013. The growth dynamics were, therefore, higher than for food exports in general (+4.5%), and thus, the share of the export value of stimulants in total agricultural exports increased from 13.5% to 15.6% over the period under consideration. Foreign sales of goods from the group under discussion was still almost twice as high as e.g. the export of dairy products, which had been considered to be a major driving force of trade from the moment of accession to the EU. The import of stimulants in the previous year was almost 6% higher than the year before, amounting to EUR 2.17 billion. At a less than 3.4% growth dynamics of overall agricultural imports, this meant a relative growth of significance of stimulants in the food imports (from 14.3% to 14.6%).


Commodity structure of trade
For several years, a decisive factor for the fact that Poland exports more stimulants than it imports has been the annually growing export of tobacco and tobacco products, the overwhelming majority of which are cigarettes. Exactly 55.6% of earnings from exports of stimulants is accounted for by the sales of these articles. The growth dynamics of this subgroup were +27% in the European currency, much higher than the growth rate of exports of overall stimulants (+21%).
A lower increase of exports (+15%) was recorded in the segment “coffee, tea, extracts, cocoa, spices”, the exports of which accounted for 24% of earnings from the total sale of stimulants in the period under consideration. In this subgroup, of greatest importance are coffee and tea extracts as well as coffee beans, while tea as well as cocoa products and spices (mainly pepper) are less important.
Since Poland, for geographical reasons, is naturally condemned to import these goods, the exchange balance still remains definitely negative. The significance of alcohol in the export of stimulants dropped. Although there was improvement in exports (a 5% increase of value), its dynamics were so low in relation to other stimulant groups that the significance of alcohol dropped from 11.6% to 10.1%, while the stabilization of imports resulted in an improvement of the trade balance which was nevertheless still negative. The export of waters and soft drinks were higher by 24% than in 2013, and their significance in the total export of stimulants increased from 8.7% to 8.9%.
In imports, products from the group of coffee, teas, their extracts, cocoa products and spices invariably remained the most significant. In the previous year, they accounted for nearly a half of expenditure on the purchase of all stimulants (47.1%). As in the case of the export of commodities from this group, the import was characterized by an increase in relation to the previous year’s value, although the increase was less dynamical here (-3%). The imports of tobacco and tobacco products increased by 20%, and the import value of alcoholic beverages was almost identical as in 2013. The purchase of mineral waters and soft drinks dropped by approx. 2%, however, their share in the total stimulant import value is negligible, only 4%. The foreign trade value of stimulants (understood as the sum of the export and import values) in 2014 was higher by 14.8% than the year before and reached EUR 5.49 billion. Trade in these articles grew at a considerably higher rate than the year before. France remained the most important partner, due to a 44% increase of the export value; moreover, the significance of Germany, Italy and the Czech Republic slightly dropped.
Geographical structure of trade in stimulants
The export of stimulants is directed, above all (86.8% of value), to the countries of the European Union, including the former Fifteen, receiving 61.9% of the entire exports of stimulants in the previous year, in comparison with 60.6% the year before. In value terms, this meant an increase by 23.7%, to EUR 2.897 billion, for the entire UE-27. This reflects the growth rate of the total export of stimulants. On the other hand, there was a slight decrease in significance of the Commonwealth of Independent States, to which 3.1% of the total exported stimulants were sent in the period under discussion, in comparison with 4.7% the year before. Outlets of low significance are still the groupings of ASEAN (stimulants worth EUR 1.7 million were exported there, mainly coffee beans and extracts) and Mercosur (EUR 2.97 million; coffee beans and unprocessed tobacco). A slightly higher share in the structure of recipients of Polish stimulants in 2014 was characterized by the Eurasian Economic Union (this direction saw exports of stimulants worth EUR 60.9 million, mainly alcohol and unprocessed tobacco to Russia, i.e. commodities which had not been covered by the import ban imposed by Russia in August) as well as Middle Eastern and North African countries (EUR 76.2 million, mainly Turkey and Israel). A specific feature of the trade in stimulants, both in export and import, is a quite fragmented geographic structure. Nevertheless, one can distinguish the most important markets for stimulants from Poland. Due to a growth of exports by more than 44% per annum, France remained the main recipient of Polish stimulants, and at a 6% increase of export to Germany, this country remained the second largest market for stimulants from Poland. Exports to Italy (for years, the third largest recipient of Polish stimulants in terms of value) increased by 16%.
Exports to the Czech Republic increased by 19%, and to the Netherlands by 34%. An even more dynamic increase was recorded in Belgium, where 43% more stimulants were exported than in 2013. On the other hand, exports to Russia and the USA dropped (by 7% and 9%, respectively).
The main partners in the trade exchange of stimulants, who increased their imports from Poland, include Hungary, Austria, the United Kingdom, Slovakia, Romania, Lithuania. The significance of other EU countries was lower, not exceeding 2%. The major directions of export of Polish stimulants outside the Community countries in 2013 remained, as already mentioned, Russia and the USA. Ukraine remained another significant market.
In imports of stimulants to Poland, the countries of the Community continue to be the main partners. In the previous year, they had a 58.2% share in the value of total exports of the goods under consideration (56% in 2013), of which the countries of the former Fifteen accounted for nearly half of the overall imports of stimulants. A continually increasing role was played by developing countries, supplying mainly agricultural raw materials such as cocoa, coffee beans, or tea and spices. Here, of slightly greater importance than in exports are the groupings of ASEAN and Mercosur. The value of imports from the Association of South-East Asian Nations amounted to EUR 125.5 million, which is less than 3.8% of the overall import of stimulants (mainly coffee beans and pepper from Vietnam – EUR 89.6 million). Imports from the Mercosur reached a value of EUR 150.5 million, consisting mainly of coffee beans and unprocessed tobacco from Brazil.
Among the suppliers of stimulants to Poland, Germany remains the most important partner – in 2014, every fifth Euro spent on the purchase of stimulants reached our western neighbours, and the imported goods were, above all, coffee extracts and beans as well as spirits. Brazil remained the second largest supplier of these goods in 2014, sending stimulants to Poland with a 6% lower value than in 2013; those were, above all, unprocessed tobacco and coffee beans. The value of the imports of stimulants from the Netherlands (mainly cocoa etc.) increased by 36%, and from Ivory Coast (cocoa products) by 25%. There was a 1% increase in imports from Vietnam (coffee and pepper), and the value of stimulants imported from Italy (mainly wines, vermouths and unprocessed tobacco) increased by 18% in comparison with the levels of 2013. 5% more stimulants were imported from France (mainly wines and processed tobacco), whereas imports from the UK (tea, spirits) dropped by 21%. The purchase of stimulants from the USA increased by 4%. However, decreases were recorded in the case of Ecuador.


Coffee, tea, coffee and tea extracts, cocoa products, spices – export
Exports of the entire subgroup brought EUR 763.1 million in the previous year, 15% more than the year before. Traditionally, the most important item was the export, or practically re-export, of coffee beans (a 41% share in the sales value of the subgroup) with a 32.6% increase in sales. At the same time, exports of coffee and tea extracts dropped by 4.7%, and exports of cocoa products (pulp and powder) increased by 8%. Increases were also recorded in exports of tea (+12.4%) and spices, mainly pepper as well as thyme and bay leaves (+25%). Countries of the European Union received 77.8% of the value of exports from this subgroup (in comparison with 72.6% the year before) worth EUR 635.8 million. The share of the countries of the Commonwealth of Independent States showed another slight decrease in the comparative period, from 11.2% to 12.7% (moreover, the value of exports to this group decreased in the period under consideration by 13.2% to EUR 70.74 million in comparison with EUR 81.4 million in 2013). The Czech Republic became the most important recipient of goods in the group under discussion. Exports in this direction increased in terms of value by 45.3% to EUR 128.8 million (mainly due to the export value of coffee, which increased by 70%, whereas the export of extracts in this direction decreased in terms of value by 11.4%). In Germany, the second country in terms of the value of goods received from Poland in the subgroup under consideration, a 11.5% decline was recorded. In this direction, mostly coffee beans and extracts were sent. An increase was observed in the case of the third largest recipient of products from the group under discussion in terms of value – France. In this direction, Poland sent mainly tea and coffee as well as cocoa. Although exports of coffee beans increased by only 6.9% to EUR 4.1 million, a dynamic increase in the export value of tea (+12.5% to EUR 30.7 million) and cocoa pulp (+21.8% to EUR 25.6 million) accounted for a more than 12.1% increase in the value of total products - from the subgroup under discussion - exported in this direction (to EUR 66.9 million). Exports to the UK developed slightly less dynamically. The value of exports in this direction increased by 8.3% to EUR 44.1 million, mainly due to a near 23% increase of exports of tea (to EUR 17.2 million) and extracts (to EUR 17.07 million). These two product groups were the main commodities from the category of stimulants, exported in this direction. In the case of Hungary, a 55.6% increase to EUR 39.1 million was recorded (mainly extracts, tea and coffee), and exports to Slovakia increased by 47.7% to EUR 24.3 million. Sales to Russia and Ukraine dropped: in 2014, 11.3% and 12.7%, respectively, less products from the group “coffee, tea, coffee and tea extracts, cocoa products, spices” were sent there (in total, for EUR 32.7 million and EUR 28.3 million, respectively). In the case of Russia, the decrease was mainly connected with a considerable drop in the exports of extracts (-29% to EUR 8.98 million) and cocoa pulp (-52.06% to EUR 2.66 million), while Ukraine received 13.7% less coffee (worth EUR 11 million). Exports to Latvia were almost twice as high as the year before (EUR 27.3 million). There was also an increase in the value of exports to Lithuania (+41.5% to EUR 22 million), exports to the Netherlands increased by 61.4% (to EUR 19.9 million). Other quite significant EU recipients of stimulants from the subgroup under consideration are Italy (EUR 16.6 million), Sweden (EUR 15 million), Belgium (EUR 11.9 million), Bulgaria (EUR 11.4 million), Cyprus (EUR 10.9 million).

Alcoholic beverages – export
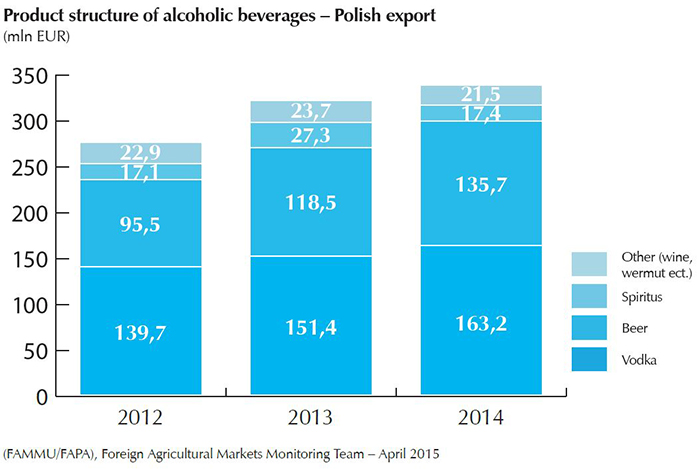
In 2014, slightly higher quantities of alcohol were sent outside Poland than in 2013. The value of exported beer was higher by 14.5%, a 7.8% increase was recorded in the case of spirits such as vodka, whisky, etc. However, due to a decrease in the export value of rectified spirits by 36.4% and other alcohols (including wines and vermouths) by 9.5%, the total export value of alcohols increased by just 5%, and their significance in the export of stimulants dropped to 10.1% (from 11.6% in 2013). Products worth less than EUR 337.7 million were sent abroad. The most important outlets for Polish alcohol continue to be the EU market and North America.
Traditionally, exports included, above all, spirits (vodkas and similar products), bearing the code PCN 2208, the sales of which increased by 7.8% to EUR 163.2 million. In 2014, this segment had a 48% share in the value structure of the subgroup, in comparison with 47% in 2013, which means a certain increase in significance. It occurred despite a dynamic increase in the sales of products from the other significant segment of alcohol exports – beer (code PCN 2203), sales of which increased by 14.5% to EUR 135.7 million, and the share in the entire subgroup increased from 37% to 40%. The share of the already mentioned denatured spirits (e.g. rectified spirit) – bearing the code PCN 2207 – in the value structure of the subgroup decreased from 9% to 5%, since the value of sales dropped by 36.4% to EUR 17.4 million. The export of “other fermented beverages” bearing the code PCN 2206 (including mead among others) decreased by 8.8% to EUR 12.5 million, and its role continues to be negligible. This is the case, at least for now, with wines (a 2.9% increase to EUR 7.9 million was recorded).
The change of the geographical structure of the export of alcohol, observed already in 2013, was maintained. The United States – for many years, the most important recipient of Polish alcohols, mainly vodkas and beer – continues to give way to the EU countries. Despite a drop in the value of exports of alcohol to the US market in the observed period by 11.2% to EUR 33.2 million, the USA was still more important than Germany and remained the second largest recipient of Polish alcohol products in terms of value. Exports to another North American country – Canada – decreased less dynamically, by 4.3% to EUR 7.6 million. In general, exports to the EU increased by 8.5% to EUR 254.3 million, and the share of member states as recipients of alcohol from Poland grew from 73% to 75.3%. Sales (above all, of spirits) to France (the main recipient of Polish alcohol) increased by 18.7% to EUR 80.6 million. On the other hand, the value of exports to the Netherlands, which became the third largest recipient of alcohols sent from Poland, increased by almost two and a half (to EUR 33.1 million). In this direction, more beer was sent above all (a double increase, to EUR 31.7 million). However, there was a considerable drop in the value of exports of rectified spirits to the Netherlands (to just EUR 10.8 thousand, from EUR 1.97 million in 2013). Exports of alcohol to Germany decreased. The export value of 2013’s main product from the group of alcohols sent to our western neighbour – rectified spirits – dropped by 31.8% to EUR 9.8 million. On the other hand, there was a 22% increase in the export of beer – EUR 14.2 million.
The significance of other countries of the Community was relatively lower. Exports to Hungary (mainly of beer) decreased by 10.7% to EUR 17.5 million. To Italy, goods from the subgroup under consideration were sold for EUR 14.6 million (+20.1%), and to the Czech Republic, for EUR 12.2 million (11.1%) mainly beer and wines. Exports to the UK (mainly of beer and vodkas) increased by 21.7% to EUR 10.7 million, and Lithuania showed a 31.6% drop to EUR 9.9 million (mainly due to a 40% decline in exports of beer, to EUR 1.1 million). Exports to Ireland (mainly of beer) increased by 7.7% to EUR 8.8 million, and in the case of Romania, a 1.67% decline in the exports of alcohol (mainly beer), to EUR 7.9 million, was recorded. Export (mainly of beer) to Bulgaria increased by 9.9% to EUR 5.3 million.
The export of alcohols to less significant markets was in decline – the value of exports to Slovakia was lower by 16.7% than the year before (EUR 5 million; mainly beer), a 5.2% decrease was recorded with Cyprus (to EUR 4.8 million; beer), and alcohols sent to Mexico had a value lower by 37% than in 2013 (EUR 2.7 million). A decrease by 0.1% was recorded in the case of exports of goods from the subgroup under discussion to Chile (to EUR 2.2 million). In Belgium, a 67.4% decline was recorded, to 1.8 million. On the other hand, there was an increase in exports to less significant recipients of Polish alcohol: Greece (+112.8% to EUR 1.5 million), Austria (+34.6% to EUR 1.5 million), Israel (+58.6% to EUR 1.4 million). Alcohol products worth EUR 14.7 million (+3.3%) were directed to customs warehouses, for stores and supplies.
Mineral water and soft drinks
The value of exports of water and soft drinks amounted to EUR 296.8 million in the period under analysis and was almost 24% higher than the year before. The commodity structure of trade in this subgroup is dominated by sweetened, carbonated and other beverages, accounting for approx. 93.8% of the trade value. The sales take place mainly within the Single Market (79.2% of value) and is implemented in many directions.
In 2014, the Czech Republic remained the main recipient of Polish soft drinks and water, with a 48% increase in the value of water exported from Poland, to EUR 47.8 million. The second place in this regard, with an 8.6% increase, was occupied by the UK (EUR 31.4 million). Another significant direction was Slovakia; water and beverages worth EUR 26.9 million were sold there (+15.8%). Among significant importers of mineral waters and soft drinks from Poland, increases were recorded in Germany (+28.7% to EUR 20.7 million), Israel (+8.7% to EUR 17.3 million), France (+99.5% to EUR 15.9 million), Hungary (+47.2% to EUR 11.8 million), Romania (+4.6% to EUR 11.5 million), Bulgaria (+46.6% to EUR 8.5 million), the USA (+1.2% to EUR 7.7 million), as well as Latvia, Italy, United Arab Emirates and Estonia. In Lithuania, the situation was stable (EUR 18.2 million), and the export of water to the USA showed a 5.7% decrease. Outside the Community, besides Israel, the USA and the UAE, certain quantities of mineral water and soft drinks were also sent, among others, to Russia (-11.5% to EUR 3.8 million) and Turkey (where the export value of water doubled to EUR 2.7 million).
Import– coffee, tea, cocoa and extracts still at the lead in the commodity structure
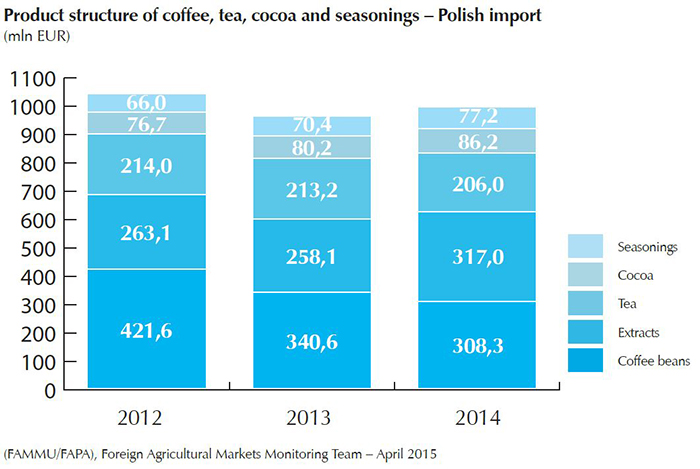
In the imports of stimulants, the most important were still the products from the subgroup “Coffee, tea, cocoa, spices”; this segment showed a 3% increase in the value of imports, to EUR 994.7 million. Less than half (45.9%) of the amounts allocated for the purchase of all stimulants was spent in the previous year on commodities from the subgroup under consideration. The value of imports of coffee beans dropped by 9.5%, mainly due to a decrease in purchases from the main suppliers - Germany, which provided 8.6% less (for EUR 110.25 million), as well as Vietnam (by 9.2% to EUR 66.3 million) and Brazil (by 15.14% to EUR 45.9 million). Certain quantities of coffee were also imported from Italy (EUR 13.6 million; +20.1%), Uganda (EUR 7.56 million), the Czech Republic (EUR 6.71 million), the UK (EUR 5.57 million), Honduras (EUR 4.44 million). Imports of coffee extracts in terms of value dropped by 3.4% to a level of EUR 206 million. The main supplier of such products remained Germany with a 2.7% decrease in imports (to EUR 61.1 million). As in the year before, Ecuador came second (-15.8% to EUR 46.3 million); further places among the suppliers of extracts to Poland were occupied by: France (EUR 18.6 million, +39.4%), Spain (EUR 12.8 million, +42.5%), the UK (EUR 11.3 million, -12.6%), Columbia (EUR 9.4 million; +22.7%), as well as Brazil, Vietnam and Hungary (above EUR 5 million). Cocoa products showed a 22.8% increase to EUR 317 million. They were imported, above all, from Ivory Coast (EUR 101.56 million, +24.4%), the Netherlands (EUR 92.76 million, +68.7%), as well as Germany (EUR 53.97 million, -+15.1%), France (EUR 22.19 million; +153%) and Ghana (EUR 20.67 million, - 49.1%). Imports of cocoa products from other directions did not exceed the value of EUR 10 million. Imports of tea increased by 7.5%. Sri Lanka became the main supplier, despite a 3% drop (EUR 12.41 million), with Germany coming second with a 71% increase of the import value of tea to Poland. The previous year’s leader, Kenya, dropped to the third position (EUR 11.9 million; -16%). Imports of tea increased from India (+9.6% to EUR 10.7 million), China (+59.7% to EUR 10.45 million) and the United Arab Emirates (+26% to EUR 2.84 million). A decrease was also recorded in Indonesia (-16% to EUR 5.9 million) and Vietnam (-10.1% to EUR 3.7 million).
There was a 9.6% increase in the imports of spices, purchased, above all, in Vietnam (EUR 23.8 million, +19.9%), as well as in Germany (EUR 9.67 million, +24.4%), India (EUR 6.37 million, +39.6%), China (EUR 5.57 million, +6.5%), Indonesia (EUR 5.29 million, -28.8%) and Spain (EUR 4.88 million, -17.5%). The Community countries accounted for 51.2% of stimulants from the group “coffee, tea, coffee and tea extracts, cocoa products, spices” imported to Poland. On the purchases of these goods within the Single Market, Polish traders spent a total of EUR 504.1 million, which is 9.9% more than the year before. Although a considerable part of the group under discussion comprise raw materials, the leader of the suppliers remains a highly developed EU country – Germany (EUR 246.9 million), re-exporting the imported goods to Poland after processing.
Alcoholic beverages – import
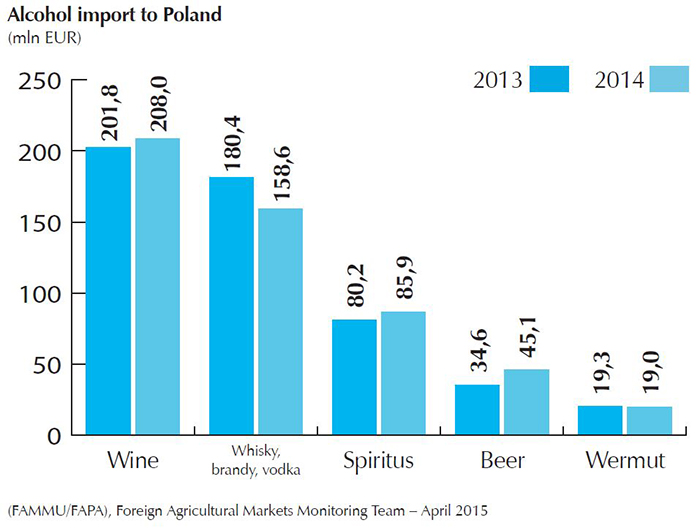
In 2014, with an almost identical export value as in 2013, alcohols remained the second most important subgroup of imported stimulants. Wines (code PCN 2204) continue to be the most significant item, with a 40% share – the value of imports increased by 3.1% to EUR 208 million. Imports of spirits (whisky, brandy, vodka, etc.), bearing the code PCN 2208, are very important as well, although purchases in this segment decreased quite dynamically (-12.1% to EUR 158.6 million). On the other hand, the import of denatured spirits with the code 2207 (rectified spirit) showed a 7.2% increase in value to EUR 85.9 million. The import value of beer (code 2203) increased by 30.2%, its share in the purchase structure of alcohol increased to 9%. The value of imported vermouths (PCN 2205) decreased by 1.1%.
The geographical structure of the import of alcohol is quite fragmented, yet 81.9% of the amounts were spent on products from the Community states. With an increase of value by 18.5%, Germany was the most important supplier – EUR 111 million. The main goods imported from this country included, above all, rectified spirit as well as wines and spirits. Imports from the UK dropped by 19% to EUR 65.1 million (mainly whisky etc.), while the value of imports of alcohol from Italy increased by 8% to EUR 58.9 million (wines and vermouths). In the case of imports from France, a 3.7% increase to EUR 37.5 million was recorded, comprising, obviously, wines and, to a certain extent, spirits such as brandy, cognac, etc. The value of imports from Spain dropped by 7.2% to EUR 23.7 million (mainly wines), and imports from Finland (mostly vodka) decreased by 25.4% to the value of EUR 16.9 million. Also, imports from Hungary (mostly wines) were higher than the year before – by 59.7% (reaching a value of EUR 16.4 million). Large quantities of alcohol within the Community were also imported from Portugal (EUR 13.8 million), Bulgaria (EUR 13.3 million), the Czech Republic (EUR 13.2 million), Estonia (EUR 9.7 million), the Netherlands (EUR 9 million), Ireland (EUR 8.7 million), Greece and Lithuania (EUR 6.2 million each), Sweden (EUR 5.8 million), Belgium (EUR 4.8 million), Austria (EUR 1.8 million).
Among the non-EU countries, the most important supplier of alcohol (mainly wines and spirits) was the USA –EUR 50.1 million was spent on purchases, 15.1% more than the year before. Certain batches of such products also reached the Polish market from Chile (EUR 13 million, +7.3%), Moldova (EUR 7.2 million, - 0.1%), Australia, Georgia, Mexico, South Africa, Argentina and other directions.
Mineral water and soft drinks
The value of mineral water and soft drinks purchased abroad in 2014, EUR 85.7 million, was 2% lower than the year before. These products are still quite an insignificant component of imports (with only a 4% share in the import structure of stimulants), and are imported, above all (87.8%), from the EU. The top of the list of suppliers of water and soft drinks to Poland, with a 23.3% share in the geographical structure, is occupied by Germany – purchases from this direction increased by 42.7% to EUR 20 million. Similar decrease dynamics were recorded in the second leading partner in 2014 – Austria (+45.3% to EUR 16.3 million). The third largest country in terms of value of imported mineral water and soft drinks, with an only 0.4% increase in value, became the previous year’s leader – the Czech Republic (EUR 15.2 million). The significance of other directions was lower. Imports from Hungary dropped by 21% to EUR 7.9 million, while imports from the Netherlands decreased even more dynamically, by 60% to EUR 4.6 million, and a 5.2% increase to EUR 3.1 million was recorded in the case of France. Imports of water and soft drinks from South Korea more than doubled (EUR 2.7 million). Other major suppliers include Italy, Taiwan, Canada, the USA, Belgium, Croatia (for EUR 1.1– 1.9 million).
Confectionery products without cocoa content include: chewing gum, licorice extract, white chocolate, tablets including sore throat lozenges, sugar-coated confectionery products, jelly products and jellies, boiled sweets including filled, toffee candies, caramels, confectionery products in the form of compressed tablets, and others, not mentioned above.
The volume of exports of confectionery products without cocoa content in 2014 increased by 10% to nearly 67.8 thousand tons. The value of exported goods increased slightly less dynamically, i.e. by above 9%, to nearly EUR 252.2 million (EUR 230.2 million in 2013). At the same time, nearly 49.9 thousand tons of these products (an increase by 8% from 46 thousand tons) were imported to Poland for EUR 152.3 million, which is 9% more in comparison with EUR 139.9 million in 2013. As a result, the positive account balance increased by 11% to EUR 99.8 million (in relation to EUR 90.3 million earlier). The volume showed a surplus of 17.9 thousand tons, and the balance increased by 16% from 15.4 thousand tons. The improvement of results in the foreign trade of confectionery products without cocoa content is a result of a slightly higher growth dynamics in export than import.
Chocolate products
As in the previous years, amongst the groups of goods analyzed in this chapter, chocolate products (confectionery products with chocolate content) were the most valuable item in Polish export and import of products in the sugar and confectionery industry. In 2014, the volumes of Polish foreign trade in these products ended with a positive balance amounting to EUR 611.2 million, constituting, however, a decrease year-over-year by more than 3% from EUR 633.1 million in 2013 (EUR 507.4 million in 2012). In terms of volume, the positive balance decreased even more dynamically, by 8% to 121.3 thousand tons (in comparison with 131.3 thousand tons the year before and 111.2 thousand tons in 2012). In previous years, the positive balance was growing year by year. The decrease thereof results from the limitation of exports to the UK, the main outlet for Polish chocolates.
In 2014, 248.7 thousand tons of these products were exported, for a value of EUR 1062.5 million (in 2013, 258.6 thousand for EUR 1067 million). The export volume was lower by 4%, and the export value dropped minimally, by 0.4%. At the same time, the import volume was stable at 127.4 thousand tons, but its value was higher by 4%, with an increase to EUR 451.3 million (127.3 thousand tons for EUR 433.9 million in 2013).
Stimulants – exports growing more dynamically than imports
Stimulants have an increasing significance in the Polish agricultural and food trade. 2014 brought another increase in the qualitative change which had been observed since 2009: the value of exports in the group of commodities under consideration exceeded imports to an even greater extent than the year before; moreover, the high growth dynamics of exports were accompanied by a significantly lower increase of imports, which translated into an increase of the positive balance of trade exchange of these products. In the previous year, stimulants worth nearly EUR 3.34 billion were sent abroad, resulting in a 21% increase in relation to 2013. The growth dynamics were, therefore, higher than for food exports in general (+4.5%), and thus, the share of the export value of stimulants in total agricultural exports increased from 13.5% to 15.6% over the period under consideration. Foreign sales of goods from the group under discussion was still almost twice as high as e.g. the export of dairy products, which had been considered to be a major driving force of trade from the moment of accession to the EU. The import of stimulants in the previous year was almost 6% higher than the year before, amounting to EUR 2.17 billion. At a less than 3.4% growth dynamics of overall agricultural imports, this meant a relative growth of significance of stimulants in the food imports (from 14.3% to 14.6%).
Commodity structure of trade
For several years, a decisive factor for the fact that Poland exports more stimulants than it imports has been the annually growing export of tobacco and tobacco products, the overwhelming majority of which are cigarettes. Exactly 55.6% of earnings from exports of stimulants is accounted for by the sales of these articles. The growth dynamics of this subgroup were +27% in the European currency, much higher than the growth rate of exports of overall stimulants (+21%).
A lower increase of exports (+15%) was recorded in the segment “coffee, tea, extracts, cocoa, spices”, the exports of which accounted for 24% of earnings from the total sale of stimulants in the period under consideration. In this subgroup, of greatest importance are coffee and tea extracts as well as coffee beans, while tea as well as cocoa products and spices (mainly pepper) are less important.
Since Poland, for geographical reasons, is naturally condemned to import these goods, the exchange balance still remains definitely negative. The significance of alcohol in the export of stimulants dropped. Although there was improvement in exports (a 5% increase of value), its dynamics were so low in relation to other stimulant groups that the significance of alcohol dropped from 11.6% to 10.1%, while the stabilization of imports resulted in an improvement of the trade balance which was nevertheless still negative. The export of waters and soft drinks were higher by 24% than in 2013, and their significance in the total export of stimulants increased from 8.7% to 8.9%.
In imports, products from the group of coffee, teas, their extracts, cocoa products and spices invariably remained the most significant. In the previous year, they accounted for nearly a half of expenditure on the purchase of all stimulants (47.1%). As in the case of the export of commodities from this group, the import was characterized by an increase in relation to the previous year’s value, although the increase was less dynamical here (-3%). The imports of tobacco and tobacco products increased by 20%, and the import value of alcoholic beverages was almost identical as in 2013. The purchase of mineral waters and soft drinks dropped by approx. 2%, however, their share in the total stimulant import value is negligible, only 4%. The foreign trade value of stimulants (understood as the sum of the export and import values) in 2014 was higher by 14.8% than the year before and reached EUR 5.49 billion. Trade in these articles grew at a considerably higher rate than the year before. France remained the most important partner, due to a 44% increase of the export value; moreover, the significance of Germany, Italy and the Czech Republic slightly dropped.
Geographical structure of trade in stimulants
The export of stimulants is directed, above all (86.8% of value), to the countries of the European Union, including the former Fifteen, receiving 61.9% of the entire exports of stimulants in the previous year, in comparison with 60.6% the year before. In value terms, this meant an increase by 23.7%, to EUR 2.897 billion, for the entire UE-27. This reflects the growth rate of the total export of stimulants. On the other hand, there was a slight decrease in significance of the Commonwealth of Independent States, to which 3.1% of the total exported stimulants were sent in the period under discussion, in comparison with 4.7% the year before. Outlets of low significance are still the groupings of ASEAN (stimulants worth EUR 1.7 million were exported there, mainly coffee beans and extracts) and Mercosur (EUR 2.97 million; coffee beans and unprocessed tobacco). A slightly higher share in the structure of recipients of Polish stimulants in 2014 was characterized by the Eurasian Economic Union (this direction saw exports of stimulants worth EUR 60.9 million, mainly alcohol and unprocessed tobacco to Russia, i.e. commodities which had not been covered by the import ban imposed by Russia in August) as well as Middle Eastern and North African countries (EUR 76.2 million, mainly Turkey and Israel). A specific feature of the trade in stimulants, both in export and import, is a quite fragmented geographic structure. Nevertheless, one can distinguish the most important markets for stimulants from Poland. Due to a growth of exports by more than 44% per annum, France remained the main recipient of Polish stimulants, and at a 6% increase of export to Germany, this country remained the second largest market for stimulants from Poland. Exports to Italy (for years, the third largest recipient of Polish stimulants in terms of value) increased by 16%.
Exports to the Czech Republic increased by 19%, and to the Netherlands by 34%. An even more dynamic increase was recorded in Belgium, where 43% more stimulants were exported than in 2013. On the other hand, exports to Russia and the USA dropped (by 7% and 9%, respectively).
The main partners in the trade exchange of stimulants, who increased their imports from Poland, include Hungary, Austria, the United Kingdom, Slovakia, Romania, Lithuania. The significance of other EU countries was lower, not exceeding 2%. The major directions of export of Polish stimulants outside the Community countries in 2013 remained, as already mentioned, Russia and the USA. Ukraine remained another significant market.
In imports of stimulants to Poland, the countries of the Community continue to be the main partners. In the previous year, they had a 58.2% share in the value of total exports of the goods under consideration (56% in 2013), of which the countries of the former Fifteen accounted for nearly half of the overall imports of stimulants. A continually increasing role was played by developing countries, supplying mainly agricultural raw materials such as cocoa, coffee beans, or tea and spices. Here, of slightly greater importance than in exports are the groupings of ASEAN and Mercosur. The value of imports from the Association of South-East Asian Nations amounted to EUR 125.5 million, which is less than 3.8% of the overall import of stimulants (mainly coffee beans and pepper from Vietnam – EUR 89.6 million). Imports from the Mercosur reached a value of EUR 150.5 million, consisting mainly of coffee beans and unprocessed tobacco from Brazil.
Among the suppliers of stimulants to Poland, Germany remains the most important partner – in 2014, every fifth Euro spent on the purchase of stimulants reached our western neighbours, and the imported goods were, above all, coffee extracts and beans as well as spirits. Brazil remained the second largest supplier of these goods in 2014, sending stimulants to Poland with a 6% lower value than in 2013; those were, above all, unprocessed tobacco and coffee beans. The value of the imports of stimulants from the Netherlands (mainly cocoa etc.) increased by 36%, and from Ivory Coast (cocoa products) by 25%. There was a 1% increase in imports from Vietnam (coffee and pepper), and the value of stimulants imported from Italy (mainly wines, vermouths and unprocessed tobacco) increased by 18% in comparison with the levels of 2013. 5% more stimulants were imported from France (mainly wines and processed tobacco), whereas imports from the UK (tea, spirits) dropped by 21%. The purchase of stimulants from the USA increased by 4%. However, decreases were recorded in the case of Ecuador.
Coffee, tea, coffee and tea extracts, cocoa products, spices – export
Exports of the entire subgroup brought EUR 763.1 million in the previous year, 15% more than the year before. Traditionally, the most important item was the export, or practically re-export, of coffee beans (a 41% share in the sales value of the subgroup) with a 32.6% increase in sales. At the same time, exports of coffee and tea extracts dropped by 4.7%, and exports of cocoa products (pulp and powder) increased by 8%. Increases were also recorded in exports of tea (+12.4%) and spices, mainly pepper as well as thyme and bay leaves (+25%). Countries of the European Union received 77.8% of the value of exports from this subgroup (in comparison with 72.6% the year before) worth EUR 635.8 million. The share of the countries of the Commonwealth of Independent States showed another slight decrease in the comparative period, from 11.2% to 12.7% (moreover, the value of exports to this group decreased in the period under consideration by 13.2% to EUR 70.74 million in comparison with EUR 81.4 million in 2013). The Czech Republic became the most important recipient of goods in the group under discussion. Exports in this direction increased in terms of value by 45.3% to EUR 128.8 million (mainly due to the export value of coffee, which increased by 70%, whereas the export of extracts in this direction decreased in terms of value by 11.4%). In Germany, the second country in terms of the value of goods received from Poland in the subgroup under consideration, a 11.5% decline was recorded. In this direction, mostly coffee beans and extracts were sent. An increase was observed in the case of the third largest recipient of products from the group under discussion in terms of value – France. In this direction, Poland sent mainly tea and coffee as well as cocoa. Although exports of coffee beans increased by only 6.9% to EUR 4.1 million, a dynamic increase in the export value of tea (+12.5% to EUR 30.7 million) and cocoa pulp (+21.8% to EUR 25.6 million) accounted for a more than 12.1% increase in the value of total products - from the subgroup under discussion - exported in this direction (to EUR 66.9 million). Exports to the UK developed slightly less dynamically. The value of exports in this direction increased by 8.3% to EUR 44.1 million, mainly due to a near 23% increase of exports of tea (to EUR 17.2 million) and extracts (to EUR 17.07 million). These two product groups were the main commodities from the category of stimulants, exported in this direction. In the case of Hungary, a 55.6% increase to EUR 39.1 million was recorded (mainly extracts, tea and coffee), and exports to Slovakia increased by 47.7% to EUR 24.3 million. Sales to Russia and Ukraine dropped: in 2014, 11.3% and 12.7%, respectively, less products from the group “coffee, tea, coffee and tea extracts, cocoa products, spices” were sent there (in total, for EUR 32.7 million and EUR 28.3 million, respectively). In the case of Russia, the decrease was mainly connected with a considerable drop in the exports of extracts (-29% to EUR 8.98 million) and cocoa pulp (-52.06% to EUR 2.66 million), while Ukraine received 13.7% less coffee (worth EUR 11 million). Exports to Latvia were almost twice as high as the year before (EUR 27.3 million). There was also an increase in the value of exports to Lithuania (+41.5% to EUR 22 million), exports to the Netherlands increased by 61.4% (to EUR 19.9 million). Other quite significant EU recipients of stimulants from the subgroup under consideration are Italy (EUR 16.6 million), Sweden (EUR 15 million), Belgium (EUR 11.9 million), Bulgaria (EUR 11.4 million), Cyprus (EUR 10.9 million).
Alcoholic beverages – export
In 2014, slightly higher quantities of alcohol were sent outside Poland than in 2013. The value of exported beer was higher by 14.5%, a 7.8% increase was recorded in the case of spirits such as vodka, whisky, etc. However, due to a decrease in the export value of rectified spirits by 36.4% and other alcohols (including wines and vermouths) by 9.5%, the total export value of alcohols increased by just 5%, and their significance in the export of stimulants dropped to 10.1% (from 11.6% in 2013). Products worth less than EUR 337.7 million were sent abroad. The most important outlets for Polish alcohol continue to be the EU market and North America.
Traditionally, exports included, above all, spirits (vodkas and similar products), bearing the code PCN 2208, the sales of which increased by 7.8% to EUR 163.2 million. In 2014, this segment had a 48% share in the value structure of the subgroup, in comparison with 47% in 2013, which means a certain increase in significance. It occurred despite a dynamic increase in the sales of products from the other significant segment of alcohol exports – beer (code PCN 2203), sales of which increased by 14.5% to EUR 135.7 million, and the share in the entire subgroup increased from 37% to 40%. The share of the already mentioned denatured spirits (e.g. rectified spirit) – bearing the code PCN 2207 – in the value structure of the subgroup decreased from 9% to 5%, since the value of sales dropped by 36.4% to EUR 17.4 million. The export of “other fermented beverages” bearing the code PCN 2206 (including mead among others) decreased by 8.8% to EUR 12.5 million, and its role continues to be negligible. This is the case, at least for now, with wines (a 2.9% increase to EUR 7.9 million was recorded).
The change of the geographical structure of the export of alcohol, observed already in 2013, was maintained. The United States – for many years, the most important recipient of Polish alcohols, mainly vodkas and beer – continues to give way to the EU countries. Despite a drop in the value of exports of alcohol to the US market in the observed period by 11.2% to EUR 33.2 million, the USA was still more important than Germany and remained the second largest recipient of Polish alcohol products in terms of value. Exports to another North American country – Canada – decreased less dynamically, by 4.3% to EUR 7.6 million. In general, exports to the EU increased by 8.5% to EUR 254.3 million, and the share of member states as recipients of alcohol from Poland grew from 73% to 75.3%. Sales (above all, of spirits) to France (the main recipient of Polish alcohol) increased by 18.7% to EUR 80.6 million. On the other hand, the value of exports to the Netherlands, which became the third largest recipient of alcohols sent from Poland, increased by almost two and a half (to EUR 33.1 million). In this direction, more beer was sent above all (a double increase, to EUR 31.7 million). However, there was a considerable drop in the value of exports of rectified spirits to the Netherlands (to just EUR 10.8 thousand, from EUR 1.97 million in 2013). Exports of alcohol to Germany decreased. The export value of 2013’s main product from the group of alcohols sent to our western neighbour – rectified spirits – dropped by 31.8% to EUR 9.8 million. On the other hand, there was a 22% increase in the export of beer – EUR 14.2 million.
The significance of other countries of the Community was relatively lower. Exports to Hungary (mainly of beer) decreased by 10.7% to EUR 17.5 million. To Italy, goods from the subgroup under consideration were sold for EUR 14.6 million (+20.1%), and to the Czech Republic, for EUR 12.2 million (11.1%) mainly beer and wines. Exports to the UK (mainly of beer and vodkas) increased by 21.7% to EUR 10.7 million, and Lithuania showed a 31.6% drop to EUR 9.9 million (mainly due to a 40% decline in exports of beer, to EUR 1.1 million). Exports to Ireland (mainly of beer) increased by 7.7% to EUR 8.8 million, and in the case of Romania, a 1.67% decline in the exports of alcohol (mainly beer), to EUR 7.9 million, was recorded. Export (mainly of beer) to Bulgaria increased by 9.9% to EUR 5.3 million.
The export of alcohols to less significant markets was in decline – the value of exports to Slovakia was lower by 16.7% than the year before (EUR 5 million; mainly beer), a 5.2% decrease was recorded with Cyprus (to EUR 4.8 million; beer), and alcohols sent to Mexico had a value lower by 37% than in 2013 (EUR 2.7 million). A decrease by 0.1% was recorded in the case of exports of goods from the subgroup under discussion to Chile (to EUR 2.2 million). In Belgium, a 67.4% decline was recorded, to 1.8 million. On the other hand, there was an increase in exports to less significant recipients of Polish alcohol: Greece (+112.8% to EUR 1.5 million), Austria (+34.6% to EUR 1.5 million), Israel (+58.6% to EUR 1.4 million). Alcohol products worth EUR 14.7 million (+3.3%) were directed to customs warehouses, for stores and supplies.
Mineral water and soft drinks
The value of exports of water and soft drinks amounted to EUR 296.8 million in the period under analysis and was almost 24% higher than the year before. The commodity structure of trade in this subgroup is dominated by sweetened, carbonated and other beverages, accounting for approx. 93.8% of the trade value. The sales take place mainly within the Single Market (79.2% of value) and is implemented in many directions.
In 2014, the Czech Republic remained the main recipient of Polish soft drinks and water, with a 48% increase in the value of water exported from Poland, to EUR 47.8 million. The second place in this regard, with an 8.6% increase, was occupied by the UK (EUR 31.4 million). Another significant direction was Slovakia; water and beverages worth EUR 26.9 million were sold there (+15.8%). Among significant importers of mineral waters and soft drinks from Poland, increases were recorded in Germany (+28.7% to EUR 20.7 million), Israel (+8.7% to EUR 17.3 million), France (+99.5% to EUR 15.9 million), Hungary (+47.2% to EUR 11.8 million), Romania (+4.6% to EUR 11.5 million), Bulgaria (+46.6% to EUR 8.5 million), the USA (+1.2% to EUR 7.7 million), as well as Latvia, Italy, United Arab Emirates and Estonia. In Lithuania, the situation was stable (EUR 18.2 million), and the export of water to the USA showed a 5.7% decrease. Outside the Community, besides Israel, the USA and the UAE, certain quantities of mineral water and soft drinks were also sent, among others, to Russia (-11.5% to EUR 3.8 million) and Turkey (where the export value of water doubled to EUR 2.7 million).
Import– coffee, tea, cocoa and extracts still at the lead in the commodity structure
In the imports of stimulants, the most important were still the products from the subgroup “Coffee, tea, cocoa, spices”; this segment showed a 3% increase in the value of imports, to EUR 994.7 million. Less than half (45.9%) of the amounts allocated for the purchase of all stimulants was spent in the previous year on commodities from the subgroup under consideration. The value of imports of coffee beans dropped by 9.5%, mainly due to a decrease in purchases from the main suppliers - Germany, which provided 8.6% less (for EUR 110.25 million), as well as Vietnam (by 9.2% to EUR 66.3 million) and Brazil (by 15.14% to EUR 45.9 million). Certain quantities of coffee were also imported from Italy (EUR 13.6 million; +20.1%), Uganda (EUR 7.56 million), the Czech Republic (EUR 6.71 million), the UK (EUR 5.57 million), Honduras (EUR 4.44 million). Imports of coffee extracts in terms of value dropped by 3.4% to a level of EUR 206 million. The main supplier of such products remained Germany with a 2.7% decrease in imports (to EUR 61.1 million). As in the year before, Ecuador came second (-15.8% to EUR 46.3 million); further places among the suppliers of extracts to Poland were occupied by: France (EUR 18.6 million, +39.4%), Spain (EUR 12.8 million, +42.5%), the UK (EUR 11.3 million, -12.6%), Columbia (EUR 9.4 million; +22.7%), as well as Brazil, Vietnam and Hungary (above EUR 5 million). Cocoa products showed a 22.8% increase to EUR 317 million. They were imported, above all, from Ivory Coast (EUR 101.56 million, +24.4%), the Netherlands (EUR 92.76 million, +68.7%), as well as Germany (EUR 53.97 million, -+15.1%), France (EUR 22.19 million; +153%) and Ghana (EUR 20.67 million, - 49.1%). Imports of cocoa products from other directions did not exceed the value of EUR 10 million. Imports of tea increased by 7.5%. Sri Lanka became the main supplier, despite a 3% drop (EUR 12.41 million), with Germany coming second with a 71% increase of the import value of tea to Poland. The previous year’s leader, Kenya, dropped to the third position (EUR 11.9 million; -16%). Imports of tea increased from India (+9.6% to EUR 10.7 million), China (+59.7% to EUR 10.45 million) and the United Arab Emirates (+26% to EUR 2.84 million). A decrease was also recorded in Indonesia (-16% to EUR 5.9 million) and Vietnam (-10.1% to EUR 3.7 million).
There was a 9.6% increase in the imports of spices, purchased, above all, in Vietnam (EUR 23.8 million, +19.9%), as well as in Germany (EUR 9.67 million, +24.4%), India (EUR 6.37 million, +39.6%), China (EUR 5.57 million, +6.5%), Indonesia (EUR 5.29 million, -28.8%) and Spain (EUR 4.88 million, -17.5%). The Community countries accounted for 51.2% of stimulants from the group “coffee, tea, coffee and tea extracts, cocoa products, spices” imported to Poland. On the purchases of these goods within the Single Market, Polish traders spent a total of EUR 504.1 million, which is 9.9% more than the year before. Although a considerable part of the group under discussion comprise raw materials, the leader of the suppliers remains a highly developed EU country – Germany (EUR 246.9 million), re-exporting the imported goods to Poland after processing.
Alcoholic beverages – import
In 2014, with an almost identical export value as in 2013, alcohols remained the second most important subgroup of imported stimulants. Wines (code PCN 2204) continue to be the most significant item, with a 40% share – the value of imports increased by 3.1% to EUR 208 million. Imports of spirits (whisky, brandy, vodka, etc.), bearing the code PCN 2208, are very important as well, although purchases in this segment decreased quite dynamically (-12.1% to EUR 158.6 million). On the other hand, the import of denatured spirits with the code 2207 (rectified spirit) showed a 7.2% increase in value to EUR 85.9 million. The import value of beer (code 2203) increased by 30.2%, its share in the purchase structure of alcohol increased to 9%. The value of imported vermouths (PCN 2205) decreased by 1.1%.
The geographical structure of the import of alcohol is quite fragmented, yet 81.9% of the amounts were spent on products from the Community states. With an increase of value by 18.5%, Germany was the most important supplier – EUR 111 million. The main goods imported from this country included, above all, rectified spirit as well as wines and spirits. Imports from the UK dropped by 19% to EUR 65.1 million (mainly whisky etc.), while the value of imports of alcohol from Italy increased by 8% to EUR 58.9 million (wines and vermouths). In the case of imports from France, a 3.7% increase to EUR 37.5 million was recorded, comprising, obviously, wines and, to a certain extent, spirits such as brandy, cognac, etc. The value of imports from Spain dropped by 7.2% to EUR 23.7 million (mainly wines), and imports from Finland (mostly vodka) decreased by 25.4% to the value of EUR 16.9 million. Also, imports from Hungary (mostly wines) were higher than the year before – by 59.7% (reaching a value of EUR 16.4 million). Large quantities of alcohol within the Community were also imported from Portugal (EUR 13.8 million), Bulgaria (EUR 13.3 million), the Czech Republic (EUR 13.2 million), Estonia (EUR 9.7 million), the Netherlands (EUR 9 million), Ireland (EUR 8.7 million), Greece and Lithuania (EUR 6.2 million each), Sweden (EUR 5.8 million), Belgium (EUR 4.8 million), Austria (EUR 1.8 million).
Among the non-EU countries, the most important supplier of alcohol (mainly wines and spirits) was the USA –EUR 50.1 million was spent on purchases, 15.1% more than the year before. Certain batches of such products also reached the Polish market from Chile (EUR 13 million, +7.3%), Moldova (EUR 7.2 million, - 0.1%), Australia, Georgia, Mexico, South Africa, Argentina and other directions.
Mineral water and soft drinks
The value of mineral water and soft drinks purchased abroad in 2014, EUR 85.7 million, was 2% lower than the year before. These products are still quite an insignificant component of imports (with only a 4% share in the import structure of stimulants), and are imported, above all (87.8%), from the EU. The top of the list of suppliers of water and soft drinks to Poland, with a 23.3% share in the geographical structure, is occupied by Germany – purchases from this direction increased by 42.7% to EUR 20 million. Similar decrease dynamics were recorded in the second leading partner in 2014 – Austria (+45.3% to EUR 16.3 million). The third largest country in terms of value of imported mineral water and soft drinks, with an only 0.4% increase in value, became the previous year’s leader – the Czech Republic (EUR 15.2 million). The significance of other directions was lower. Imports from Hungary dropped by 21% to EUR 7.9 million, while imports from the Netherlands decreased even more dynamically, by 60% to EUR 4.6 million, and a 5.2% increase to EUR 3.1 million was recorded in the case of France. Imports of water and soft drinks from South Korea more than doubled (EUR 2.7 million). Other major suppliers include Italy, Taiwan, Canada, the USA, Belgium, Croatia (for EUR 1.1– 1.9 million).


