


In terms of value, the share of this product group in foreign sales of agriculture and food products in 2014 was equal to 10.9%, while in 2012 it was around 9.5%. In the period of January-October 2015, sales of confectionary was equal to 11.3%, which proves the dynamic development of this industry and strengthening of its position on foreign markets. The value of confectionery export in 2014 was equal to €2.4 billion, which in relation to last year, highlights an increase of over 16% (in 2013 – €2.1 billion), as compared to 2012, there was an increase of about 40% (in 2012 – €1.7 billion). In the period of January-October 2015, in relation to the same period in the previous year, there was an increase in export by 13% to €2.2 billion, whereas the year before, it was worth €1.9 billion.
In 2014, as in previous years, about 75% of the value of export of confectionery products (80% of the volume) was delivered to EU markets, of which, the most was to Germany (approx. 20%), UK (approx. 15%) and the Czech Republic (approx. 6%). Important recipients of Polish confectionery were also France, the Netherlands, Hungary and Italy. Polish confectionary was also delivered to the markets of countries outside the EU, mostly to Russia, Saudi Arabia, USA, Ukraine, United Arab Emirates, China, Israel and Canada.
When it comes to the structure of export of Polish confectionery, almost half of its value was chocolate and products containing cocoa, approximately 40% were pastries, cakes, biscuits and wafers, and over 10% was confectionery not containing cocoa.
One of the major recipients of confectionery products (including white chocolate) is Saudi Arabia (€20.9 million). In 2014, it took second place following Germany (€51.6 million) and giving United Kingdom (€14.3 million) the third place. The total value of the export of these products in 2014, amounted to nearly €276 million.
Confectionery products without cocoa content
Confectionery products without cocoa content include: chewing gum, licorice extract, white chocolate, tablets including sore throat lozenges, sugar-coated confectionery products, jelly products and jellies, boiled sweets including filled, toffee candies, caramels, confectionery products in the form of compressed tablets, and others, not mentioned above.
The volume of exports of confectionery products without cocoa content in 2014 increased by 10% to nearly 67.8 thousand tons. The value of exported goods increased slightly less dynamically, i.e. by above 9%, to nearly €252.2 million (€230.2 million in 2013). At the same time, nearly 49.9 thousand tons of these products (an increase by 8% from 46 thousand tons) were imported to Poland for €152.3 million, which is 9% more in comparison with €139.9 million in 2013. As a result, the positive account balance increased by 11% to €99.8 million (in relation to €90.3 million earlier). The volume showed a surplus of 17.9 thousand tons, and the balance increased by 16% from 15.4 thousand tons. The improvement of results in the foreign trade of confectionery products without cocoa content is a result of a slightly higher growth dynamics in export than import.
Export
In 2014, the main export goods were the products bearing the code CN 1704 90 99 (other confectionery products without cocoa content). The export of these sweets amounted to 21.4 thousand tons (-0.5%, a 32% share) worth €108.2 million (+3%, 43% share). They were followed by toffee candies and caramels (code: CN 1704 90 75). 18.3 thousand tons (5% more) of these products were sold on foreign markets for €44.7 million (+8%). It was an 18% share in terms of value and 27% in terms of volume.
Further places were occupied by boiled sweets including filled (CN 1704 90 71), of which 9.9 thousand tons (a 15% share) were sold outside Poland for €29.9 million (a 12% share). Other significant products in the structure of exports were: white chocolate (CN 1704 90 30), products bearing the code CN 1704 90 65, and other sugar-coated products (CN 1704 90 61) as well as pastes, including marzipan, in direct packaging with a net content of 1 kg or more (CN 1704 90 51). Major outlets for Polish confectionery products without cocoa content remained the EU countries, receiving 63% of the export (42.5 thousand tons for €155 million – the share in terms of value was higher by more than 1 pp than in terms of quantity). 2014 saw a decrease in significance of EU countries, the share of which in the geographical structure of exports dropped by nearly 2 pp year-over-year. On the other hand, there was a gain for third countries (mainly Saudi Arabia and United Arab Emirates). The CIS reached 9%, 1/4 was sent to other third countries, including countries associated in NAFTA, 5% (Canada and the USA).
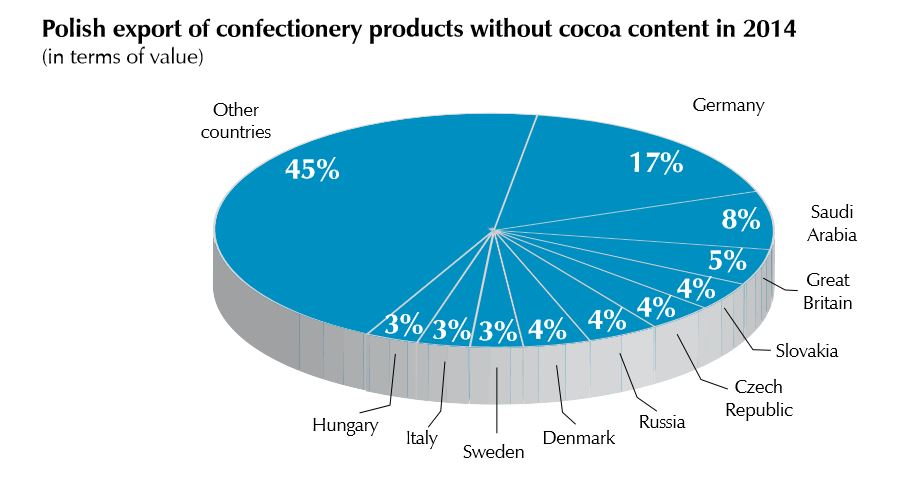
The main recipient of Polish confectionery products without cocoa content in 2014 was Germany, accounting for a 21% share in terms of quantity. Germany bought 14.4 thousand tons of these products for €44 million. Further positions, with a considerably lower share, were occupied by Saudi Arabia (30% more, to 5.1 thousand tons), Russia (3.3 thousand tons), the Czech Republic and the United Kingdom (2.9 thousand tons each), Slovakia and Denmark (2.6 thousand tons each), Italy, Romania and Hungary. In the period under analysis, the exports of confectionery products without cocoa content comprised 6.5% in terms of quantity and 15.9% in terms of value in the export of the group of commodities comprising sugar, sugar industry products and confectionery products. In 2013, this share amounted to 5.7% and 13.9%, respectively, whereas exports of confectionery products without cocoa content in 2013 were 1.2% (1.1% the year before) in terms of value in the export of total agricultural and food products, as well as 0.3% in terms of quantity thereof (0.3% in the previous year as well).
Import
27% of the imports of goods from this group comprised other jelly products and jellies, including fruit pastes as confectionery products (CN 1704 90 65), of which 13.6 thousand tons (2% less) were imported for €33.9 million (-6%, a 22% share). Due to a dynamic 38% increase in volume, the second place, with a 13% share, was held by toffee candies, caramels and similar candies (CN 1704 90 75), purchased in the quantity of 6.3 thousand tons for €18.3 million (+31%). Right behind them, were boiled sweets including filled (CN 1704 90 71, 6 thousand tons) and sugar-coated products (code CN 1704 90 61, 5.9 thousand tons). Slightly less products with the code CN 1704 90 30 were purchased (5.5 thousand tons).
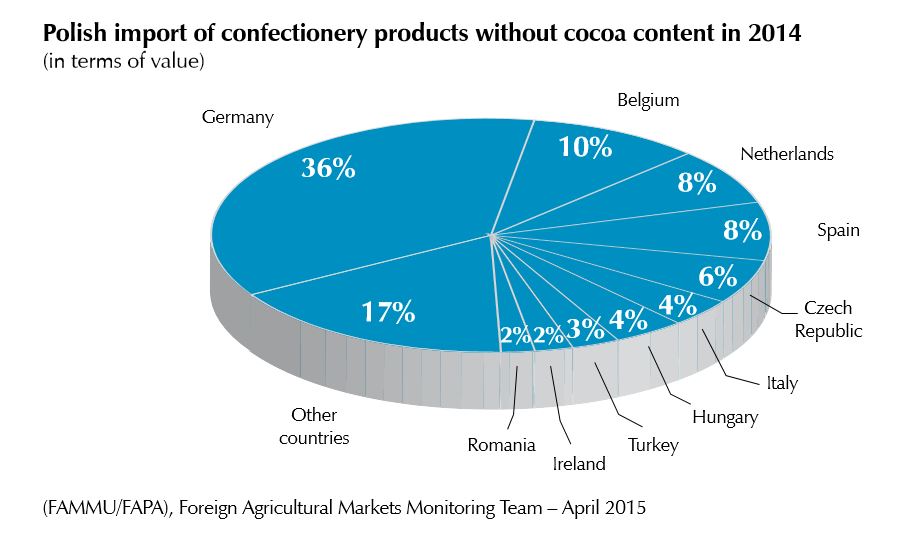
The main suppliers of products with the code CN 1704 to the Polish market include the EU countries, from which 91% of these goods were imported. Similarly as in exports, the significance of the EU in the geographic structure of imports also decreased by nearly 2 pp, while there was an increase in the case of third countries and Turkey, a long-term candidate to the EU. In 2014, as in previous years, confectionery products without cocoa content were imported, above all, from Germany – 16.4 thousand tons, worth €54.3 million, accounting for a 33% share in terms of quantity and 36% in terms of value. The volume of imports from this country dropped by 1.5%, but their value increased by the same percentage. After an increase of ¾ to 5.8 thousand tons, the second place was occupied by Belgium (a 12% share), pushing the Netherlands into third place (9%), the fourth position was held by the Czech Republic (+22% to 4.4 thousand tons). Further places were occupied by Spain, Hungary, Turkey, Italy and the United Kingdom as well as Slovakia. It is worth noticing dynamic increases in purchases from China (2.5 times), Indonesia and Ukraine (3.5 times each). However, these countries individually have not been significant suppliers so far.
In 2014, the imports of confectionery products without cocoa content accounted for a 1.0% share (in 2013, a 1.0% share as well) in terms of value and 0.2% (the year before, 0.2% as well) in terms of quantity in the overall imports of agricultural and food products. The share of the group of commodities comprising sugar, sugar industry products and confectionery products in imports, in the period under analysis was 7.8% (6.9% the year before) in terms of quantity and 18.3% (16.7% in 2013) in terms of value of imports in this group.
Chocolate products
As in the previous years, amongst the groups of goods analyzed in this chapter, chocolate products (confectionery products with chocolate content) were the most valuable item in Polish export and import of products in the sugar and confectionery industry. In 2014, the volumes of Polish foreign trade in these products ended with a positive balance amounting to €611.2 million, constituting, however, a decrease year-over-year by more than 3% from €633.1 million in 2013 (€507.4 million in 2012). In terms of volume, the positive balance decreased even more dynamically, by 8% to 121.3 thousand tons (in comparison with 131.3 thousand tons the year before and 111.2 thousand tons in 2012). In previous years, the positive balance was growing year by year. The decrease thereof results from the limitation of exports to the UK, the main outlet for Polish chocolates.
In 2014, 248.7 thousand tons of these products were exported, for a value of €1062.5 million (in 2013, 258.6 thousand for €1067 million). The export volume was lower by 4%, and the export value dropped minimally, by 0.4%. At the same time, the import volume was stable at 127.4 thousand tons, but its value was higher by 4%, with an increase to €451.3 million (127.3 thousand tons for €433.9 million in 2013).
Export
The highest exports of chocolate products were recorded to the EU countries, where 3/4 of the exports reached. The Union countries purchased 188.3 thousand tons in Poland for 729.5 million (a 69% share). This means a decrease by 5% in terms of quantity and 7% in terms of value. However, the commodity structure did not undergo any significant changes, although the significance of the EU dropped (by 0.7 pp YOY in terms of quantity), whereas third countries had gained (+1.1 pp). Other considerable outlets were Russia, the USA and, to a lesser extent, Saudi Arabia, United Arab Emirates, China and Israel.
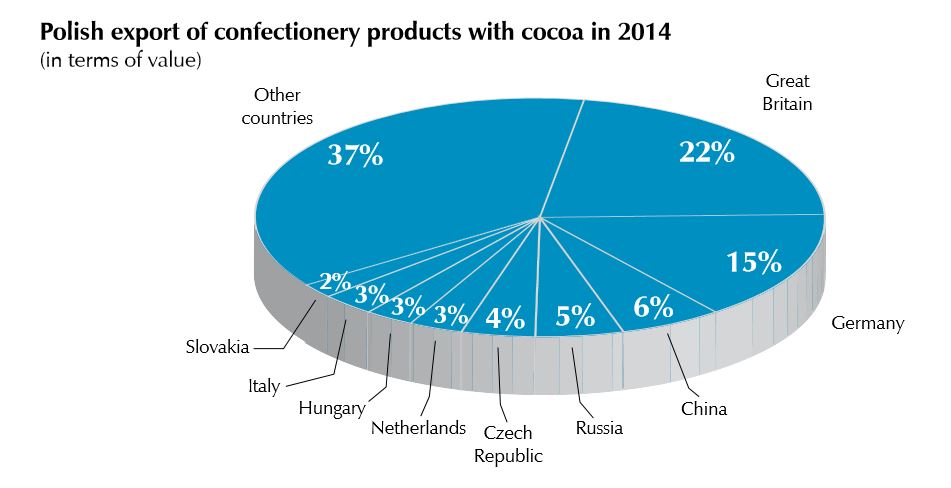
Most Polish confectionery products with cocoa content reached the UK again – 65 thousand tons, which meant a gain of €231.3 million. This accounted for a 26% share in exports in terms of quantity. However, 2014 showed a reduction in exports to the UK, and the decline reached 10% in terms of quantity and 8% in terms of value year-over-year. Other significant outlets were Germany (a decrease by 6% to 28.9 thousand tons, a 12% share), the Czech Republic (-4% to 15 thousand tons, a 6% share), the Netherlands (+19% to 9.9 thousand tons, a 4% share), Russia, Slovakia, Romania, Hungary, Italy and the USA. Exports to the top ten largest outlets accounted for 2/3 of the total export of chocolate in terms of volume.
In the commodity structure of exports, the prevalence of other filled chocolate products (CN 1806 90 31) was maintained. The exports thereof dropped by 13% to 49.2 thousand tons (a 20% share), and the value approached €228.3 million (15% less), accounting for a 22% share. They were followed by paste confectionery products with cocoa content (CN 1806 90 60), of which 33.4 thousand tons for €126.8 million were sold outside Poland. This accounted for a 13% share in terms of quantity and 12% in terms of value in the structure of exports. Due to a 12% increase in volume, the third place was held by products with the code CN 1806 32 90 (other filled chocolate products). The exports amounted to 29 thousand tons worth €116.1 million (a share of 12% and 11%, respectively). Slightly less chocolate products in blocks, tablets or bars (code CN 1806 31 00) and other food preparations containing cocoa with filling (CN 1806 90 90) were sold abroad. Their respective shares in the structure of exports were 11% and 10% in terms of quantity as well as 9% and 15% in terms of value.
In 2014, exports of chocolate products constituted 67.1% (64.4% the year before) of the value and 23.9% (24.2% in 2013) of the quantity of exports in the group of commodities comprising sugar, sugar industry products and confectionery products. The share in the total export of agricultural and food products was 1.2% of the quantity (1.4% the year before) and 5.0% of the value (5.2% year before).
Import
In 2014, confectionery products with cocoa content were imported almost exclusively from the EU countries – in terms of both value and quantity, a total of 97% of the products bearing the custom tariff code CN 1806 were purchased in countries of the European Union. Third countries gained in importance in 2014; their share in the geographical structure of imports increased by 2 pp, exceeding a 2% share. Beside the decrease in imports from the EU, was a dynamic increase in purchases from Ivory Coast, the world’s largest producer of cocoa beans (up to 1.8 thousand tons), and, to a much lesser extent, from Ukraine.
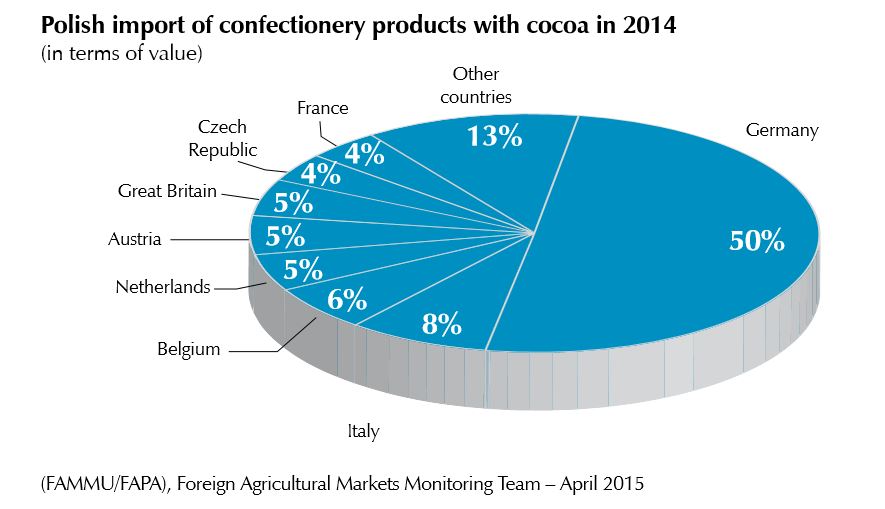
For many years, Germany has been the main supplier of chocolate products to the Polish market; in 2014, 58.3 thousand tons were imported from this country for €226.6 million. Imports dropped by 5% in terms of quantity, but increased by 1% in terms of value. The imports from Germany accounted for 46% of all confectionery products with cocoa content imported to Poland. Significantly smaller suppliers of chocolate products to the Polish market were: Belgium (+17% to 9.2 thousand tons), the Netherlands (8.1 thousand tons), the UK and the Czech Republic (7.7 thousand tons each), Italy (-37% to 7.5 thousand tons), Austria and France, as well as Slovakia. Of special interest are the imports from Ivory Coast, which increased 12.6 times in 2014, and Ukraine (up to 125 times more (!) to 501 tons).
The commodity structure of Polish imports of confectionery products with cocoa content was dominated by two products. The first one was other chocolate products in blocks, tablets or bars, filled (1806 31 00). The imports of this commodity increased by 16% to 27.5 thousand tons and by 24% to €108.4 million. This accounted for a 22% share of these goods in imports in terms of quantity and a 24% share in terms of value. The second group comprised goods bearing the code CN 1806 20 95 (other processed food products with cocoa content, in blocks, tablets or bars with a weight exceeding 2 kg or products in liquid, paste, powdered, granular or other form, in containers or immediate packaging, with a content exceeding 2 kg), of which 18.5 thousand tons (-22%) were imported for €55.8 million (-17%). The share amounted to 14% in terms of quantity and 12% in terms of value. Due to an increase by 2/3, the third place was held by products with the code CN 1806 32 90 (other filled chocolate products), the imports of which amounted to 12.1 thousand tons and €41.1 million (+56%). This accounted for a 10% share in the commodity structure in terms of quantity and 9% in terms of value. Slightly less products with the code CN 1806 90 19 were purchased (11.5 thousand tons for €57.1 million). Further places were occupied by products with codes CN 1806 20 10 (9.7 thousand tons), CN 1806 32 10 (7.8 thousand tons), and 1806 90 60 (7.6 thousand tons). Their respective shares were 8% and 6% each for the latter. In 2014, the imports of chocolate products accounted for 3.1% (3.0% in 2013) of the value and 0.6% (0.7% the year before) of the quantity of total imports of agricultural and food products. The share in the imports of the group of commodities comprising sugar, sugar industry products and confectionery products amounted to 54.1% (51.7% the year before) in terms of quality and 19.8% (18.9% the year before) in terms of volume.
(FAMMU/FAPA), Foreign Agricultural Markets Monitoring Team – April 2015.
TP
In 2014, as in previous years, about 75% of the value of export of confectionery products (80% of the volume) was delivered to EU markets, of which, the most was to Germany (approx. 20%), UK (approx. 15%) and the Czech Republic (approx. 6%). Important recipients of Polish confectionery were also France, the Netherlands, Hungary and Italy. Polish confectionary was also delivered to the markets of countries outside the EU, mostly to Russia, Saudi Arabia, USA, Ukraine, United Arab Emirates, China, Israel and Canada.
When it comes to the structure of export of Polish confectionery, almost half of its value was chocolate and products containing cocoa, approximately 40% were pastries, cakes, biscuits and wafers, and over 10% was confectionery not containing cocoa.
One of the major recipients of confectionery products (including white chocolate) is Saudi Arabia (€20.9 million). In 2014, it took second place following Germany (€51.6 million) and giving United Kingdom (€14.3 million) the third place. The total value of the export of these products in 2014, amounted to nearly €276 million.
Confectionery products without cocoa content
Confectionery products without cocoa content include: chewing gum, licorice extract, white chocolate, tablets including sore throat lozenges, sugar-coated confectionery products, jelly products and jellies, boiled sweets including filled, toffee candies, caramels, confectionery products in the form of compressed tablets, and others, not mentioned above.
The volume of exports of confectionery products without cocoa content in 2014 increased by 10% to nearly 67.8 thousand tons. The value of exported goods increased slightly less dynamically, i.e. by above 9%, to nearly €252.2 million (€230.2 million in 2013). At the same time, nearly 49.9 thousand tons of these products (an increase by 8% from 46 thousand tons) were imported to Poland for €152.3 million, which is 9% more in comparison with €139.9 million in 2013. As a result, the positive account balance increased by 11% to €99.8 million (in relation to €90.3 million earlier). The volume showed a surplus of 17.9 thousand tons, and the balance increased by 16% from 15.4 thousand tons. The improvement of results in the foreign trade of confectionery products without cocoa content is a result of a slightly higher growth dynamics in export than import.
Export
In 2014, the main export goods were the products bearing the code CN 1704 90 99 (other confectionery products without cocoa content). The export of these sweets amounted to 21.4 thousand tons (-0.5%, a 32% share) worth €108.2 million (+3%, 43% share). They were followed by toffee candies and caramels (code: CN 1704 90 75). 18.3 thousand tons (5% more) of these products were sold on foreign markets for €44.7 million (+8%). It was an 18% share in terms of value and 27% in terms of volume.
Further places were occupied by boiled sweets including filled (CN 1704 90 71), of which 9.9 thousand tons (a 15% share) were sold outside Poland for €29.9 million (a 12% share). Other significant products in the structure of exports were: white chocolate (CN 1704 90 30), products bearing the code CN 1704 90 65, and other sugar-coated products (CN 1704 90 61) as well as pastes, including marzipan, in direct packaging with a net content of 1 kg or more (CN 1704 90 51). Major outlets for Polish confectionery products without cocoa content remained the EU countries, receiving 63% of the export (42.5 thousand tons for €155 million – the share in terms of value was higher by more than 1 pp than in terms of quantity). 2014 saw a decrease in significance of EU countries, the share of which in the geographical structure of exports dropped by nearly 2 pp year-over-year. On the other hand, there was a gain for third countries (mainly Saudi Arabia and United Arab Emirates). The CIS reached 9%, 1/4 was sent to other third countries, including countries associated in NAFTA, 5% (Canada and the USA).
The main recipient of Polish confectionery products without cocoa content in 2014 was Germany, accounting for a 21% share in terms of quantity. Germany bought 14.4 thousand tons of these products for €44 million. Further positions, with a considerably lower share, were occupied by Saudi Arabia (30% more, to 5.1 thousand tons), Russia (3.3 thousand tons), the Czech Republic and the United Kingdom (2.9 thousand tons each), Slovakia and Denmark (2.6 thousand tons each), Italy, Romania and Hungary. In the period under analysis, the exports of confectionery products without cocoa content comprised 6.5% in terms of quantity and 15.9% in terms of value in the export of the group of commodities comprising sugar, sugar industry products and confectionery products. In 2013, this share amounted to 5.7% and 13.9%, respectively, whereas exports of confectionery products without cocoa content in 2013 were 1.2% (1.1% the year before) in terms of value in the export of total agricultural and food products, as well as 0.3% in terms of quantity thereof (0.3% in the previous year as well).
Import
27% of the imports of goods from this group comprised other jelly products and jellies, including fruit pastes as confectionery products (CN 1704 90 65), of which 13.6 thousand tons (2% less) were imported for €33.9 million (-6%, a 22% share). Due to a dynamic 38% increase in volume, the second place, with a 13% share, was held by toffee candies, caramels and similar candies (CN 1704 90 75), purchased in the quantity of 6.3 thousand tons for €18.3 million (+31%). Right behind them, were boiled sweets including filled (CN 1704 90 71, 6 thousand tons) and sugar-coated products (code CN 1704 90 61, 5.9 thousand tons). Slightly less products with the code CN 1704 90 30 were purchased (5.5 thousand tons).
The main suppliers of products with the code CN 1704 to the Polish market include the EU countries, from which 91% of these goods were imported. Similarly as in exports, the significance of the EU in the geographic structure of imports also decreased by nearly 2 pp, while there was an increase in the case of third countries and Turkey, a long-term candidate to the EU. In 2014, as in previous years, confectionery products without cocoa content were imported, above all, from Germany – 16.4 thousand tons, worth €54.3 million, accounting for a 33% share in terms of quantity and 36% in terms of value. The volume of imports from this country dropped by 1.5%, but their value increased by the same percentage. After an increase of ¾ to 5.8 thousand tons, the second place was occupied by Belgium (a 12% share), pushing the Netherlands into third place (9%), the fourth position was held by the Czech Republic (+22% to 4.4 thousand tons). Further places were occupied by Spain, Hungary, Turkey, Italy and the United Kingdom as well as Slovakia. It is worth noticing dynamic increases in purchases from China (2.5 times), Indonesia and Ukraine (3.5 times each). However, these countries individually have not been significant suppliers so far.
In 2014, the imports of confectionery products without cocoa content accounted for a 1.0% share (in 2013, a 1.0% share as well) in terms of value and 0.2% (the year before, 0.2% as well) in terms of quantity in the overall imports of agricultural and food products. The share of the group of commodities comprising sugar, sugar industry products and confectionery products in imports, in the period under analysis was 7.8% (6.9% the year before) in terms of quantity and 18.3% (16.7% in 2013) in terms of value of imports in this group.
Chocolate products
As in the previous years, amongst the groups of goods analyzed in this chapter, chocolate products (confectionery products with chocolate content) were the most valuable item in Polish export and import of products in the sugar and confectionery industry. In 2014, the volumes of Polish foreign trade in these products ended with a positive balance amounting to €611.2 million, constituting, however, a decrease year-over-year by more than 3% from €633.1 million in 2013 (€507.4 million in 2012). In terms of volume, the positive balance decreased even more dynamically, by 8% to 121.3 thousand tons (in comparison with 131.3 thousand tons the year before and 111.2 thousand tons in 2012). In previous years, the positive balance was growing year by year. The decrease thereof results from the limitation of exports to the UK, the main outlet for Polish chocolates.
In 2014, 248.7 thousand tons of these products were exported, for a value of €1062.5 million (in 2013, 258.6 thousand for €1067 million). The export volume was lower by 4%, and the export value dropped minimally, by 0.4%. At the same time, the import volume was stable at 127.4 thousand tons, but its value was higher by 4%, with an increase to €451.3 million (127.3 thousand tons for €433.9 million in 2013).
Export
The highest exports of chocolate products were recorded to the EU countries, where 3/4 of the exports reached. The Union countries purchased 188.3 thousand tons in Poland for 729.5 million (a 69% share). This means a decrease by 5% in terms of quantity and 7% in terms of value. However, the commodity structure did not undergo any significant changes, although the significance of the EU dropped (by 0.7 pp YOY in terms of quantity), whereas third countries had gained (+1.1 pp). Other considerable outlets were Russia, the USA and, to a lesser extent, Saudi Arabia, United Arab Emirates, China and Israel.
Most Polish confectionery products with cocoa content reached the UK again – 65 thousand tons, which meant a gain of €231.3 million. This accounted for a 26% share in exports in terms of quantity. However, 2014 showed a reduction in exports to the UK, and the decline reached 10% in terms of quantity and 8% in terms of value year-over-year. Other significant outlets were Germany (a decrease by 6% to 28.9 thousand tons, a 12% share), the Czech Republic (-4% to 15 thousand tons, a 6% share), the Netherlands (+19% to 9.9 thousand tons, a 4% share), Russia, Slovakia, Romania, Hungary, Italy and the USA. Exports to the top ten largest outlets accounted for 2/3 of the total export of chocolate in terms of volume.
In the commodity structure of exports, the prevalence of other filled chocolate products (CN 1806 90 31) was maintained. The exports thereof dropped by 13% to 49.2 thousand tons (a 20% share), and the value approached €228.3 million (15% less), accounting for a 22% share. They were followed by paste confectionery products with cocoa content (CN 1806 90 60), of which 33.4 thousand tons for €126.8 million were sold outside Poland. This accounted for a 13% share in terms of quantity and 12% in terms of value in the structure of exports. Due to a 12% increase in volume, the third place was held by products with the code CN 1806 32 90 (other filled chocolate products). The exports amounted to 29 thousand tons worth €116.1 million (a share of 12% and 11%, respectively). Slightly less chocolate products in blocks, tablets or bars (code CN 1806 31 00) and other food preparations containing cocoa with filling (CN 1806 90 90) were sold abroad. Their respective shares in the structure of exports were 11% and 10% in terms of quantity as well as 9% and 15% in terms of value.
In 2014, exports of chocolate products constituted 67.1% (64.4% the year before) of the value and 23.9% (24.2% in 2013) of the quantity of exports in the group of commodities comprising sugar, sugar industry products and confectionery products. The share in the total export of agricultural and food products was 1.2% of the quantity (1.4% the year before) and 5.0% of the value (5.2% year before).
Import
In 2014, confectionery products with cocoa content were imported almost exclusively from the EU countries – in terms of both value and quantity, a total of 97% of the products bearing the custom tariff code CN 1806 were purchased in countries of the European Union. Third countries gained in importance in 2014; their share in the geographical structure of imports increased by 2 pp, exceeding a 2% share. Beside the decrease in imports from the EU, was a dynamic increase in purchases from Ivory Coast, the world’s largest producer of cocoa beans (up to 1.8 thousand tons), and, to a much lesser extent, from Ukraine.
For many years, Germany has been the main supplier of chocolate products to the Polish market; in 2014, 58.3 thousand tons were imported from this country for €226.6 million. Imports dropped by 5% in terms of quantity, but increased by 1% in terms of value. The imports from Germany accounted for 46% of all confectionery products with cocoa content imported to Poland. Significantly smaller suppliers of chocolate products to the Polish market were: Belgium (+17% to 9.2 thousand tons), the Netherlands (8.1 thousand tons), the UK and the Czech Republic (7.7 thousand tons each), Italy (-37% to 7.5 thousand tons), Austria and France, as well as Slovakia. Of special interest are the imports from Ivory Coast, which increased 12.6 times in 2014, and Ukraine (up to 125 times more (!) to 501 tons).
The commodity structure of Polish imports of confectionery products with cocoa content was dominated by two products. The first one was other chocolate products in blocks, tablets or bars, filled (1806 31 00). The imports of this commodity increased by 16% to 27.5 thousand tons and by 24% to €108.4 million. This accounted for a 22% share of these goods in imports in terms of quantity and a 24% share in terms of value. The second group comprised goods bearing the code CN 1806 20 95 (other processed food products with cocoa content, in blocks, tablets or bars with a weight exceeding 2 kg or products in liquid, paste, powdered, granular or other form, in containers or immediate packaging, with a content exceeding 2 kg), of which 18.5 thousand tons (-22%) were imported for €55.8 million (-17%). The share amounted to 14% in terms of quantity and 12% in terms of value. Due to an increase by 2/3, the third place was held by products with the code CN 1806 32 90 (other filled chocolate products), the imports of which amounted to 12.1 thousand tons and €41.1 million (+56%). This accounted for a 10% share in the commodity structure in terms of quantity and 9% in terms of value. Slightly less products with the code CN 1806 90 19 were purchased (11.5 thousand tons for €57.1 million). Further places were occupied by products with codes CN 1806 20 10 (9.7 thousand tons), CN 1806 32 10 (7.8 thousand tons), and 1806 90 60 (7.6 thousand tons). Their respective shares were 8% and 6% each for the latter. In 2014, the imports of chocolate products accounted for 3.1% (3.0% in 2013) of the value and 0.6% (0.7% the year before) of the quantity of total imports of agricultural and food products. The share in the imports of the group of commodities comprising sugar, sugar industry products and confectionery products amounted to 54.1% (51.7% the year before) in terms of quality and 19.8% (18.9% the year before) in terms of volume.
(FAMMU/FAPA), Foreign Agricultural Markets Monitoring Team – April 2015.
TP


