

Exports increased by 5.2% to EUR 163.1 billion, and imports by 5.5%, to EUR 165.6 billion. As a result, the total foreign trade deficit increased by as much as 23% on a year-over-year basis, from EUR -1.984 to -2.446 billion. The total share of agricultural products in overall exports exceeded 13%, whereas in the case of imports, it amounted to less than 9%. In both the import and export of food, a drop in their share in overall trade occurred. A positive trade balance was recorded again in the foreign trade of agricultural and food products, contrary to the overall trade.
In 2014, the share of total exports to developed countries increased by 2 pp to 84%, the significance of the EU countries increased by the same value to 77%, the share of developed third countries remained stable (7%). In the case of developed countries, 2014 saw, nearly, an 8% increase in exports, whereas the dynamics in developed countries excluding the EU were significantly lower, approaching 3%. The share of the Eurozone in exports increased by 2 pp to 54%, and the positive dynamics of exports exceeded 9%. A higher growth rate of exports in this direction could be explained by the good economic situation. According to the International Monetary Fund, GDP increased in 2014 by 3.3% worldwide and by 1.8% in the developing countries. Improvement was also observed in Poland's main trade partners: Germany (+1.4%), France (+0.4%), the United Kingdom (+3.2%), whereas the GDP in the Eurozone increased by 0.8%. The share of exports in third countries (excluding developed ones) decreased by 2 pp to 16% due to an almost 6% drop of exports in this direction. Exports to the CIS dynamically decreased by almost 17%, and the share dropped to 8% (less by 2 pp YOY). The share of developed countries without the EU did not change (7%).
With regard to imports, a minimally higher growth rate was recorded than in exports (5.5 compared to 5.2%), the growth dynamics for the Eurozone were almost twice as high as for other EU countries, while purchases from the CIS and non-EU developed countries dropped (by slightly above 3% each). 65% of imports reached Poland from the developed countries (less by 1 pp), whereas imports from the EU amounted to 59% (+ 1 pp), and from the Eurozone, 46% (unchanged). The share of purchases in the CIS dropped by 1 pp to 13%. Due to a 14% growth in imports, the share of imports from third countries excluding developed ones and the CIS increased by 2 pp to 22%. Imports from developed countries (including the EU) showed positive dynamics (4.6%), although lower than the total imports (+5.5%), while the imports from third countries excluding developed ones increased at a rate higher than average (+7.2%), which allowed an increase of the shares of this group, in the geographical structure of the imports, by 1 pp to 35%.
Due to slightly higher growth dynamics in imports than in exports in 2014, the deficit in the balance of the foreign trade distinctly increased from EUR -1.984 billion to EUR -2.447 billion (+23%). It is also worth noticing a change in the growth rate of trade on a year-to-year basis: in 2013, exports increased by 8% YOY, and imports by 1.9%. In 2014, on the other hand, the growth rate of imports was 5.5% (strong growth YOY), and of exports, 5.2% (a distinct decrease). Trade with the EU countries showed a positive balance amounting to EUR 28.8 billion (including almost EUR 11.2 billion for the Eurozone), the trade with developed countries excluding the EU ended with a deficit of EUR 362 million, which, nevertheless, dropped by as much as 2/3 YOY. The trade exchange with developed countries in total ended with a high positive balance (EUR 28.4 billion). On the other hand, a large deficit had been recorded in the case of third countries excluding the developed ones (EUR -30.9 billion), which increased by 22%. The negative balance of trade with the CIS increased by as much as 29% to EUR -8.4 billion, and with other countries (excluding the developed ones and the CIS) increased by 19% to EUR -22.5 billion.
For many years, Germany has been the most important trade partner of Poland, both in exports and imports. In 2014, sales to the German market increased on a year-over-year basis by 10% to EUR 42.6 billion, while the imports increased by 7% to EUR 36.4 billion. In both cases, the growth dynamics were higher than in the total trade. Germany’s share in Polish trade, in the case of imports, remained unchanged at a level of 22%, and in exports it increased by 1 pp to 26%. Among the top ten largest outlets in value terms, only Russia (a 4% share) was outside the EU. In the case of imports, the top ten largest suppliers included three third countries: Russia (a 11% share), China (11%) and the USA (2%). Trade with the top ten trade partners constituted 65% of exports and 67% of total imports. It is worth noticing the large decrease in the dynamics of purchases from Russia (-9% YOY) and Ukraine (-27%, which made this country fall out of the top ten recipients).
The year 2014 brought a minimal drop in the share of agricultural and food products in the total Polish foreign trade, whereas the growth rate of food exports and imports was noticeably lower than the total trade. The share of exports dropped by 0.1 pp to 13.1%, and of imports, by 0.2 pp to 8.9%. Of special interest is the slowdown of the growth rate of the share in exports, which had been growing quite strongly for the last three years. The dynamics of imports had been subject to minimal changes in the recent years. Despite weaker dynamics of trade in agricultural and food products than in total trade in 2014, the food trade balance has been positive for years, it increased by 7% to EUR 6.6 billion in 2014. The results of the Polish foreign trade in food, in 2014, were determined by exports to the CIS (-23% YOY), including, above all, Russia (-30%) and Ukraine (-22%), which is connected with the Russo-Ukrainian conflict, the Russian embargo on EU food (assorted products), and the strong depreciation of the rouble and hryvnia. The share of the CIS countries in the geographical structure of Polish food exports decreased in 2014 by 3 pp, from 11% to 8%.
The Ministry of Economic Affairs expects that in 2015, the total Polish exports will increase by 5.5% to EUR 172.1 billion, and the imports will grow slightly slower, by 5% to EUR 173.9 billion (after a study in March 2015). The deficit will amount to EUR 1.8 billion and will be lower in the year-over-year approach.
Commodity structure of the agricultural and food trade
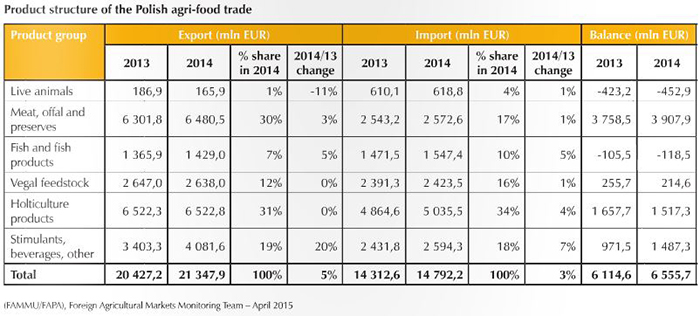
In 2014, the positive balance in the Polish agricultural and food trade increased per annum by 7% to EUR 6.5 billion. The positive trade balance in the section of processed products of animal origin and stimulants improved. In the animal section, the value of the export of milk and dairy products, meat and poultry offal, as well as processed meats increased. The positive balance in the trade of red meat decreased, mainly due to a significant drop in the export of pork and beef. The negative balance in the trade of live animals deepened again due to the continuing high imports of piglets and an increase in the purchase of poultry and cattle. In the plant section, a positive trade balance was recorded again. This was mainly caused by an increase in the export of wheat, grain mill products, starch, feed components and confectionery. The positive balance in the trade of sugar decreased due to a drop in export.
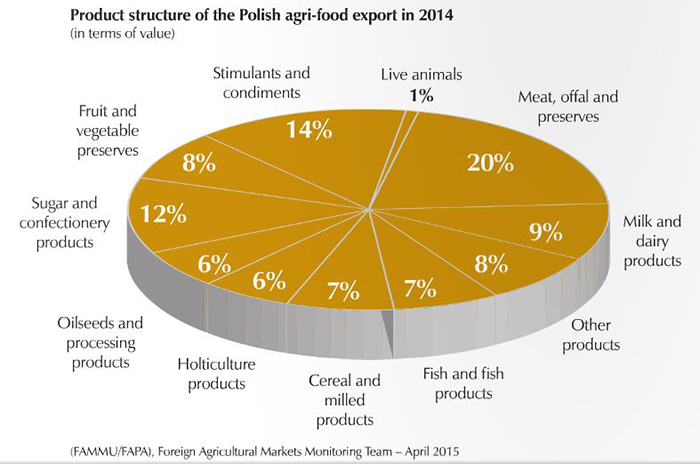
Polish agricultural and food exports were dominated by low-processed products constituting 58% of their value. Highly-processed products had a share of 24%, and unprocessed products – 19%. In comparison with 2013, the share of highly-processed products increased by 1 pp.
The export value of low-processed products increased by 4%, and that of highly-processed products – by 8%, and of unprocessed products – by 3%. In 2014, the animal section saw a 13% decrease of positive balance in the trade of red meat, mainly due to a significant decrease of proceedings from the export of pork (-24%), beef (-19%), and horsemeat (-8%). The export value of poultry meat, on the other hand, increased by 22%, and in the case of sheep and goat meat, by 15%. An increase was also recorded in revenues from the foreign sales of powdered milk (+66%), whey (+10%), processed meats (+8%), honey (+36%), fish and crustaceans (+5%). The value of sales was lower than the year before in the field of live animals (-11%), mostly cattle and horses, as well as animal fats and meals (-16%), cheese and curd (-5%), eggs and egg products (-2%), butter (-1%).
In the vegetable section, as in earlier years, of greatest significance in their export were processed products, the export value of which in 2014, nevertheless, increased only slightly (+0.3%). This group saw an increase in proceeds from the sales of starch, meals and malt (+20%), oil meals, feed ingredients and feed (+8%), confectionery (+6%) and grain mill products (+2%). On the other hand, the export value of sugar was lower than the year before (-30%), due to a drop in its profitability. There were also reductions in earnings from the export of processed vegetables and fruit (-6%), sauces, soups and thickeners (-6%), as well as vegetable oils and fats (-1%). In the group of vegetable raw materials, a positive balance in foreign trade was recorded once more, however, it was lower by 16% than in 2013. A positive balance in the trade of grains increased per annum by one third due to an increase in exports by 21%, mostly of wheat. This was influenced by an increase in the profitability of exports from Poland and other EU countries, due to the loss of profitability of supplies of American wheat and the limitations of Russian export. On the other hand, 2014 saw a reduction in earnings from the export of Polish fruit (-18%), especially apples, due to the Russian embargo imposed in August of the previous year. There was also a decrease in the export value of oilseed rape (-11%), flowers (-12%), and potatoes (-6%).
The first item in the section of other products, and, at the same time, the product with the highest value in the commodity structure of agricultural and food exports, were cigarettes; their export value increased by 8% per year, and the value of total tobacco and tobacco products increased by 27%. There was also an increase in the re-exportation of cocoa, coffee, tea and spices (+15%), the export of waters and soft drinks, (+24%) as well as alcohol and alcoholic drinks (+5%).
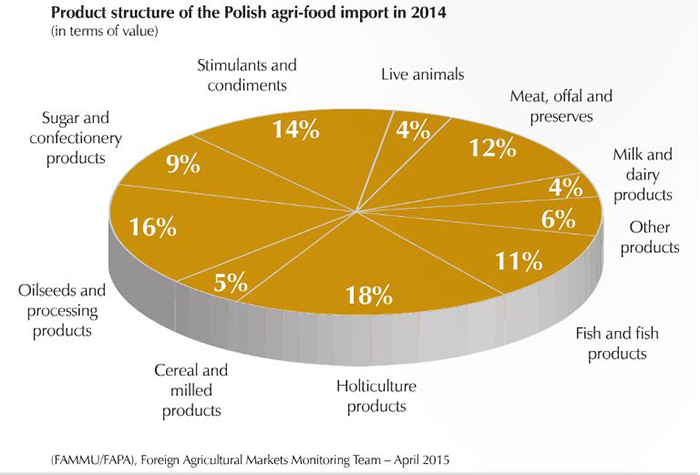
The imports of agricultural and food products to Poland in 2014 were dominated, traditionally, by low-processed products (48% of the value of supplies). Unprocessed products had a 33% share in the value of purchases, and highly-processed products – a 19% share. Within a year, the value of supplies of low-processed products increased by 5%, of highly-processed products – by 3%, and of unprocessed products – by 2%. Vegetable products constituted a half of the value of the overall agricultural and food imports. The cost of the supply of vegetable products increased by 3% in relation to 2013. To a greater extent, the export value increased in the case of processed vegetables (+15%), oil meals and feeds (+13%), as well as potatoes (+13%). Compared to the year before, more was also spent on the purchase of confectionery (+4%), grains (+4%), flowers (+6%), fresh vegetables (+2%) and fruit (+1%), as well as sauces, soups and thickeners (+3%). On the other hand, there was a decrease in expenditure on the imports of grain mill products (-16%), oilseeds (-8%), sugar and molasses (-13%), as well as vegetable fats and oils (-5%). The section of animal origin products had a share of approx. one-third in the import value of all agricultural and food products. Over the year, the value of imports of animal products increased by 2%.
Once again, the commodity with the highest value in purchases on foreign markets was pork, with a 4% decrease in expenses in comparison with 2013. There was a significant increase per annum in the value of imports of poultry meat (+21%), milk, cream and ice cream (+14%), cheese and curd (+12%), beef (+9%), sheep meat (+40%), horsemeat (+36%), and also, to a lesser extent, fish and crustaceans (+6%) as well as processed meat (+1%). Moreover, less was spent than in the year before on the purchase of animal fats and meal (-11%), butter (-4%) and processed fish (-7%). In the group of live animals, pigs remained the most important item in imports. However, the import value of these animals (mainly piglets) to Poland decreased by 6% in 2014. On the other hand, expenses on the purchase of live poultry (+27%) and cattle (+15%) were higher than the year before. In the section of other products, the greatest share in the value of imports (38%) comprised, traditionally, coffee, tea, cocoa and spices. In comparison with 2013, expenses on these goods increased by 3%. There was again an increase in value of the purchase of unmanufactured tobacco for the production of cigarettes (+20%), as well as, slightly, of alcohol and alcoholic drinks (+0.1%). On the other hand, the expenses on the import of waters and soft drinks dropped (-2%).
Geographical structure of the agricultural and food trade
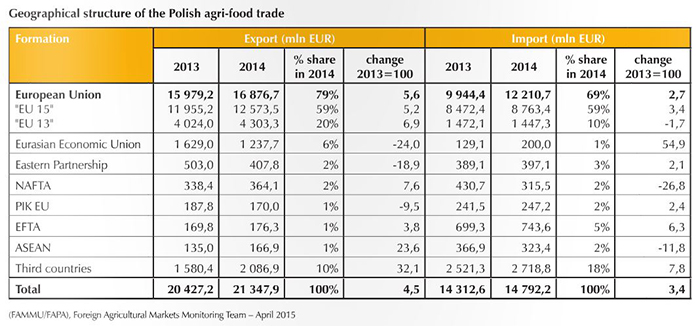
For many years, Poland’s most important partner in the agricultural and food trade has been the European Union, and this was the case in 2014 as well. The balance of trade exchange with member states improved by almost 3% due to the growth dynamics of exports being slightly higher than that of imports. In 2014, the balance of trade exchange of agricultural and food products was positive, similarly as in several recent years, and totalled, in value terms, EUR 6.55 billion in comparison with EUR 6.11 billion in 2013, which relates to a 7% growth. In the previous year, the exported agricultural products reached a value higher by 5% – EUR 21.35 billion in comparison with EUR 20.43 billion the year before. Similarly, the value of imports showed an increase as well – a total amount of EUR 14.79 billion in comparison with EUR 14.31 billion the year before – a growth of nearly 4%. We sent considerably more of all agricultural products in terms of quantity – in total, we exported 20.44 million tons abroad in comparison with 18.64 million tons the year before; in terms of quantity, the exports increased by nearly 10%. We also imported more goods to Poland, by 7% - in total, 20.85 million tons in comparison with 19.46 million tons the year before.
In 2014, the share of total exports to developed countries increased by 2 pp to 84%, the significance of the EU countries increased by the same value to 77%, the share of developed third countries remained stable (7%). In the case of developed countries, 2014 saw, nearly, an 8% increase in exports, whereas the dynamics in developed countries excluding the EU were significantly lower, approaching 3%. The share of the Eurozone in exports increased by 2 pp to 54%, and the positive dynamics of exports exceeded 9%. A higher growth rate of exports in this direction could be explained by the good economic situation. According to the International Monetary Fund, GDP increased in 2014 by 3.3% worldwide and by 1.8% in the developing countries. Improvement was also observed in Poland's main trade partners: Germany (+1.4%), France (+0.4%), the United Kingdom (+3.2%), whereas the GDP in the Eurozone increased by 0.8%. The share of exports in third countries (excluding developed ones) decreased by 2 pp to 16% due to an almost 6% drop of exports in this direction. Exports to the CIS dynamically decreased by almost 17%, and the share dropped to 8% (less by 2 pp YOY). The share of developed countries without the EU did not change (7%).
With regard to imports, a minimally higher growth rate was recorded than in exports (5.5 compared to 5.2%), the growth dynamics for the Eurozone were almost twice as high as for other EU countries, while purchases from the CIS and non-EU developed countries dropped (by slightly above 3% each). 65% of imports reached Poland from the developed countries (less by 1 pp), whereas imports from the EU amounted to 59% (+ 1 pp), and from the Eurozone, 46% (unchanged). The share of purchases in the CIS dropped by 1 pp to 13%. Due to a 14% growth in imports, the share of imports from third countries excluding developed ones and the CIS increased by 2 pp to 22%. Imports from developed countries (including the EU) showed positive dynamics (4.6%), although lower than the total imports (+5.5%), while the imports from third countries excluding developed ones increased at a rate higher than average (+7.2%), which allowed an increase of the shares of this group, in the geographical structure of the imports, by 1 pp to 35%.
Due to slightly higher growth dynamics in imports than in exports in 2014, the deficit in the balance of the foreign trade distinctly increased from EUR -1.984 billion to EUR -2.447 billion (+23%). It is also worth noticing a change in the growth rate of trade on a year-to-year basis: in 2013, exports increased by 8% YOY, and imports by 1.9%. In 2014, on the other hand, the growth rate of imports was 5.5% (strong growth YOY), and of exports, 5.2% (a distinct decrease). Trade with the EU countries showed a positive balance amounting to EUR 28.8 billion (including almost EUR 11.2 billion for the Eurozone), the trade with developed countries excluding the EU ended with a deficit of EUR 362 million, which, nevertheless, dropped by as much as 2/3 YOY. The trade exchange with developed countries in total ended with a high positive balance (EUR 28.4 billion). On the other hand, a large deficit had been recorded in the case of third countries excluding the developed ones (EUR -30.9 billion), which increased by 22%. The negative balance of trade with the CIS increased by as much as 29% to EUR -8.4 billion, and with other countries (excluding the developed ones and the CIS) increased by 19% to EUR -22.5 billion.
For many years, Germany has been the most important trade partner of Poland, both in exports and imports. In 2014, sales to the German market increased on a year-over-year basis by 10% to EUR 42.6 billion, while the imports increased by 7% to EUR 36.4 billion. In both cases, the growth dynamics were higher than in the total trade. Germany’s share in Polish trade, in the case of imports, remained unchanged at a level of 22%, and in exports it increased by 1 pp to 26%. Among the top ten largest outlets in value terms, only Russia (a 4% share) was outside the EU. In the case of imports, the top ten largest suppliers included three third countries: Russia (a 11% share), China (11%) and the USA (2%). Trade with the top ten trade partners constituted 65% of exports and 67% of total imports. It is worth noticing the large decrease in the dynamics of purchases from Russia (-9% YOY) and Ukraine (-27%, which made this country fall out of the top ten recipients).
The year 2014 brought a minimal drop in the share of agricultural and food products in the total Polish foreign trade, whereas the growth rate of food exports and imports was noticeably lower than the total trade. The share of exports dropped by 0.1 pp to 13.1%, and of imports, by 0.2 pp to 8.9%. Of special interest is the slowdown of the growth rate of the share in exports, which had been growing quite strongly for the last three years. The dynamics of imports had been subject to minimal changes in the recent years. Despite weaker dynamics of trade in agricultural and food products than in total trade in 2014, the food trade balance has been positive for years, it increased by 7% to EUR 6.6 billion in 2014. The results of the Polish foreign trade in food, in 2014, were determined by exports to the CIS (-23% YOY), including, above all, Russia (-30%) and Ukraine (-22%), which is connected with the Russo-Ukrainian conflict, the Russian embargo on EU food (assorted products), and the strong depreciation of the rouble and hryvnia. The share of the CIS countries in the geographical structure of Polish food exports decreased in 2014 by 3 pp, from 11% to 8%.
The Ministry of Economic Affairs expects that in 2015, the total Polish exports will increase by 5.5% to EUR 172.1 billion, and the imports will grow slightly slower, by 5% to EUR 173.9 billion (after a study in March 2015). The deficit will amount to EUR 1.8 billion and will be lower in the year-over-year approach.
Commodity structure of the agricultural and food trade
In 2014, the positive balance in the Polish agricultural and food trade increased per annum by 7% to EUR 6.5 billion. The positive trade balance in the section of processed products of animal origin and stimulants improved. In the animal section, the value of the export of milk and dairy products, meat and poultry offal, as well as processed meats increased. The positive balance in the trade of red meat decreased, mainly due to a significant drop in the export of pork and beef. The negative balance in the trade of live animals deepened again due to the continuing high imports of piglets and an increase in the purchase of poultry and cattle. In the plant section, a positive trade balance was recorded again. This was mainly caused by an increase in the export of wheat, grain mill products, starch, feed components and confectionery. The positive balance in the trade of sugar decreased due to a drop in export.
Polish agricultural and food exports were dominated by low-processed products constituting 58% of their value. Highly-processed products had a share of 24%, and unprocessed products – 19%. In comparison with 2013, the share of highly-processed products increased by 1 pp.
The export value of low-processed products increased by 4%, and that of highly-processed products – by 8%, and of unprocessed products – by 3%. In 2014, the animal section saw a 13% decrease of positive balance in the trade of red meat, mainly due to a significant decrease of proceedings from the export of pork (-24%), beef (-19%), and horsemeat (-8%). The export value of poultry meat, on the other hand, increased by 22%, and in the case of sheep and goat meat, by 15%. An increase was also recorded in revenues from the foreign sales of powdered milk (+66%), whey (+10%), processed meats (+8%), honey (+36%), fish and crustaceans (+5%). The value of sales was lower than the year before in the field of live animals (-11%), mostly cattle and horses, as well as animal fats and meals (-16%), cheese and curd (-5%), eggs and egg products (-2%), butter (-1%).
In the vegetable section, as in earlier years, of greatest significance in their export were processed products, the export value of which in 2014, nevertheless, increased only slightly (+0.3%). This group saw an increase in proceeds from the sales of starch, meals and malt (+20%), oil meals, feed ingredients and feed (+8%), confectionery (+6%) and grain mill products (+2%). On the other hand, the export value of sugar was lower than the year before (-30%), due to a drop in its profitability. There were also reductions in earnings from the export of processed vegetables and fruit (-6%), sauces, soups and thickeners (-6%), as well as vegetable oils and fats (-1%). In the group of vegetable raw materials, a positive balance in foreign trade was recorded once more, however, it was lower by 16% than in 2013. A positive balance in the trade of grains increased per annum by one third due to an increase in exports by 21%, mostly of wheat. This was influenced by an increase in the profitability of exports from Poland and other EU countries, due to the loss of profitability of supplies of American wheat and the limitations of Russian export. On the other hand, 2014 saw a reduction in earnings from the export of Polish fruit (-18%), especially apples, due to the Russian embargo imposed in August of the previous year. There was also a decrease in the export value of oilseed rape (-11%), flowers (-12%), and potatoes (-6%).
The first item in the section of other products, and, at the same time, the product with the highest value in the commodity structure of agricultural and food exports, were cigarettes; their export value increased by 8% per year, and the value of total tobacco and tobacco products increased by 27%. There was also an increase in the re-exportation of cocoa, coffee, tea and spices (+15%), the export of waters and soft drinks, (+24%) as well as alcohol and alcoholic drinks (+5%).
The imports of agricultural and food products to Poland in 2014 were dominated, traditionally, by low-processed products (48% of the value of supplies). Unprocessed products had a 33% share in the value of purchases, and highly-processed products – a 19% share. Within a year, the value of supplies of low-processed products increased by 5%, of highly-processed products – by 3%, and of unprocessed products – by 2%. Vegetable products constituted a half of the value of the overall agricultural and food imports. The cost of the supply of vegetable products increased by 3% in relation to 2013. To a greater extent, the export value increased in the case of processed vegetables (+15%), oil meals and feeds (+13%), as well as potatoes (+13%). Compared to the year before, more was also spent on the purchase of confectionery (+4%), grains (+4%), flowers (+6%), fresh vegetables (+2%) and fruit (+1%), as well as sauces, soups and thickeners (+3%). On the other hand, there was a decrease in expenditure on the imports of grain mill products (-16%), oilseeds (-8%), sugar and molasses (-13%), as well as vegetable fats and oils (-5%). The section of animal origin products had a share of approx. one-third in the import value of all agricultural and food products. Over the year, the value of imports of animal products increased by 2%.
Once again, the commodity with the highest value in purchases on foreign markets was pork, with a 4% decrease in expenses in comparison with 2013. There was a significant increase per annum in the value of imports of poultry meat (+21%), milk, cream and ice cream (+14%), cheese and curd (+12%), beef (+9%), sheep meat (+40%), horsemeat (+36%), and also, to a lesser extent, fish and crustaceans (+6%) as well as processed meat (+1%). Moreover, less was spent than in the year before on the purchase of animal fats and meal (-11%), butter (-4%) and processed fish (-7%). In the group of live animals, pigs remained the most important item in imports. However, the import value of these animals (mainly piglets) to Poland decreased by 6% in 2014. On the other hand, expenses on the purchase of live poultry (+27%) and cattle (+15%) were higher than the year before. In the section of other products, the greatest share in the value of imports (38%) comprised, traditionally, coffee, tea, cocoa and spices. In comparison with 2013, expenses on these goods increased by 3%. There was again an increase in value of the purchase of unmanufactured tobacco for the production of cigarettes (+20%), as well as, slightly, of alcohol and alcoholic drinks (+0.1%). On the other hand, the expenses on the import of waters and soft drinks dropped (-2%).
Geographical structure of the agricultural and food trade
For many years, Poland’s most important partner in the agricultural and food trade has been the European Union, and this was the case in 2014 as well. The balance of trade exchange with member states improved by almost 3% due to the growth dynamics of exports being slightly higher than that of imports. In 2014, the balance of trade exchange of agricultural and food products was positive, similarly as in several recent years, and totalled, in value terms, EUR 6.55 billion in comparison with EUR 6.11 billion in 2013, which relates to a 7% growth. In the previous year, the exported agricultural products reached a value higher by 5% – EUR 21.35 billion in comparison with EUR 20.43 billion the year before. Similarly, the value of imports showed an increase as well – a total amount of EUR 14.79 billion in comparison with EUR 14.31 billion the year before – a growth of nearly 4%. We sent considerably more of all agricultural products in terms of quantity – in total, we exported 20.44 million tons abroad in comparison with 18.64 million tons the year before; in terms of quantity, the exports increased by nearly 10%. We also imported more goods to Poland, by 7% - in total, 20.85 million tons in comparison with 19.46 million tons the year before.


