

In 2015, the growth dynamics of total exports grew by 0.7 percentage points year-on-year to 7.8%, whilst in imports, it dropped by 3.4 pp to 3.9%. After the deficit years, a positive balance of total trade was achieved. In 2015, the share of total exports in developed countries increased by 2 pp to 86%, the significance of EU countries grew by the same value to 79%, the share of developed third countries dropped by 1 pp to 6% (exports to the EFTA declined in importance). In total, in the case of developed countries, 2015 saw a 9.8% increase in exports, i.e. significantly higher than in total exports, whereas exports to the EFTA declined by 2.9%, and the dynamics for developed countries excluding the EU and EFTA amounted to 8.1%, lower than the total of developed countries. On the other hand, exports to the EU grew dynamically, by 0.3%, however, they were 0.2 pp lower for the eurozone, and 0.5 pp higher for EU countries with national currencies, than for the EU in total. The share of the eurozone in exports increased by 1 pp to 56%. The high growth rate of exports should be explained by the good economic situation. According to the International Monetary Fund, GDP in 2015 grew by 3.1% worldwide and by 1.9% in developing countries. An improvement was also recorded by the main trade partners of Poland: Germany (+1.5%), France (+1.1%), United Kingdom (+2.2%), and in the eurozone, GDP increased by 1.5%. The overall share of third countries excluding the developed ones declined by 2 pp to 14% due to a 2.8% drop in exports. Exports to the CIS had a key impact on this situation, having dynamically decreased by 20.4%, while the share declined to 6% (2 pp less y/y). On the other hand, the share of third countries in exports (excluding developed ones and the CIS) grew by 1 pp to 9% due to a 13.8% increase in exports in this direction. As for imports, a much lower growth rate was recorded than for exports (3.9% in comparison with 7.8%). The highest growth dynamics of imports was observed in third countries excluding developed ones and the CIS, reaching up to 16.7%, and the share of this group of countries grew by 2 pp to 24%. This was conditioned predominantly by a 16% increase in purchases from China. In the CIS, a strong, 23.7% decline in purchases was recorded, and the share of this group in the commodity structure of imports decreased by 4 pp to 9%. This was due, above all, to a 26% reduction in purchases from Russia. 67% of imports (1 pp higher) reached Poland from the developed countries, whilst imports from the EU comprised 60% (+ 1 pp), and from the eurozone, 48% (1 pp higher as well). Purchases in developed countries increased by 5.0%, and in the EU by 5.1% year-on-year, whereas the positive dynamics of imports from the eurozone was 0.1 pp higher, and from non-euro EU countries, 0.6 pp lower than for the EU in total. In the case of imports from developed countries excluding the EU and EFTA, a positive dynamics was recorded (6.9%) but the share remained unchanged (5%). Purchases from the EFTA declined slightly by 1.3%, but this did not affect the share in the commodity structure of imports from this direction (2%, unchanged). Due to the increase dynamics of imports being distinctly higher than of exports, the overall volume of Polish foreign trade in 2015 resulted in a considerable surplus amounting to $ 3.679 billion. In the previous years, the balance had always been negative, and in 2014, the deficit reached $ 2.659 billion. As for trade with the EU countries, a positive balance of € 37.1 billion was recorded (including almost € 17.3 billion for the eurozone, at a very high growth dynamics of 41.8% y/y); trade with developed countries excluding the EU and EFTA closed with a deficit of € 1 million, which was stable y/y. Overall trade with developed countries closed the year with a high positive balance (€ 36.5 billion). On the other hand, a large deficit was recorded for third countries excluding developed ones (€ -32.8 billion) and it widened by 5.7%. The negative balance of trade with the CIS dropped by 28.7% to € -6 billion, and with other countries (excluding developed ones and the CIS), it increased by 18.5% to € -26.8 billion.

For many years, Germany has been Poland’s most important trade partner, both in terms of exports and imports. In 2015, sales to the German market grew by 11% year-on-year to € 48.5 billion, whereas imports grew by 8% to € 40 billion. In both cases, the growth dynamics was higher than in total trade. Germany’s share in the Polish trade with regards to imports and exports increased by 1 pp each, to 27% and 23%, respectively. Among the top ten largest outlets in terms of value, Russia (a 3% share) was the only non-EU country. In the case of imports, the top ten largest suppliers included three third countries: China (12%, the second most important supplier), Russia (a 7% share) and the USA (3%). Trade with the top ten partners constituted 66% of both total exports and imports. It is worth noting a high dynamics of trade with the USA: exports increased by 11% and imports by 14%, making it come 12th in the geographical structure of exports and 9th in imports.
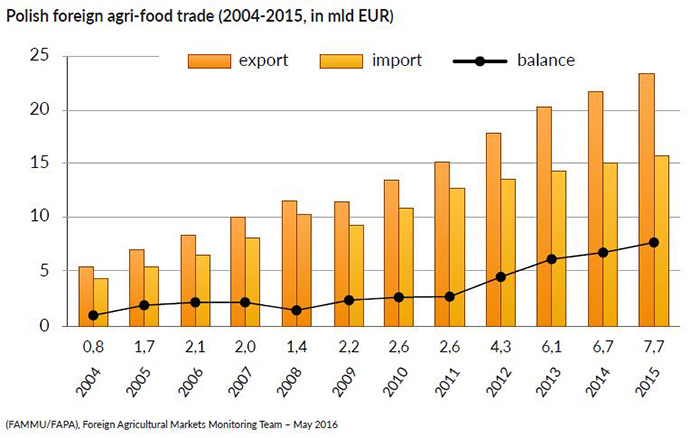
2015 brought a minimal growth of the share of agri-food products to the total Polish foreign trade, whereas the growth rate of exports was comparable to that of total trade, and in the case of imports it was higher. The share of exports remained unchanged year-on-year, amounting to 13.2%, and the share of imports grew by 0.1 pp to 9.1%. The dynamics of in the changes of the share of food trade, in total trade, has undergone minimal changes in recent years. In 2015, the export of food increased 0.6 pp faster than the year before, and the growth dynamics of imports was 1.0 pp lower year-on-year. The balance of trade in foodstuffs has been positive for years, and in 2015, it increased dynamically, by 14.3% to € 7.708 billion. The results of the Polish foreign trade in food were affected by exports to the CIS (-34% y/y), including, above all, to Russia (-55%) and Ukraine (-17%), as a result of the Russo-Ukrainian conflict, the Russian embargo on EU foods (selected products) and the strong depreciation of the rouble and hryvnia. The share of the CIS countries in the geographical structure of Polish food exports dropped by 3 pp in 2015, from 8% to 5%.


Commodity structure of the agri-food trade
In 2015, the positive balance of the Polish agri-food trade increased by 14% annually to approx. EUR 7.7 billion. The trade balance in the categories of vegetable and animal preparations as well as vegetable raw materials greatly improved. In the animal category, there was mainly growth in the export value of poultry and poultry preparations, beef, eggs, as well as fish and fish preparations. The negative balance of trade in live animals improved due to a considerable decline in the imports of pigs. The export of cereals, rapeseed, starch, meal and malt, confectionery products, fruit and vegetable preparations, as well as vegetable oils and fats increased. Simultaneously, imports of cereals declined. On the other hand, lower receipts were observed on the export of fresh fruit and vegetables, considering higher expenditures on foreign purchases. A positive balance of trade in sugar rose noticeably due to a drop in imports. The positive balance of trade in stimulants slightly decreased.
The Polish agri-food exports in 2015 were dominated by low-processed products, accounting for 56% of their value. Highly-processed goods had a 25% share, and unprocessed products accounted for 19%. Compared to 2014, the share of highly-processed products in total exports increased by 1 pp at the expense of low-processed ones. The value of exports grew by 12% for highly-processed goods, by 6% for low-processed goods, and by 7% for unprocessed products.
In 2015, in the animal category, the positive balance of trade in red meat increased by more than half, mainly due to growth, by one fourth, in proceeds from beef exports. The export value of horse meat (+7%) as well as sheep and goat meat (+22%) was also higher than the year before, with a decline in exports of pork (-1%). The positive balance of trade in poultry meat grew by 20%, due to a further growth in the value of exports (+20%). There was also an increase in receipts from the foreign sales of meat preparations (+7%), fish and fish preparations (+3%), as well as eggs and egg preparations (+19%). On the other hand, the value of sales was lower than the previous year in the case of live animals (-2%), mainly pigs and cattle, as well as dairy products: milk (-18%), cheese and curd (-11%), and butter (-2%).
In the vegetable category, as in the previous years, the most important role in exports was played by processed products; their export value in 2015 grew by 10%. This group saw an increase in receipts from the sales of starch, meal and malt (+32%), confectionery products (+15%), sauces, soups and thickeners (+10%), fruit and vegetable preparations (+5%), oil meals, feed components and feeds (+4%), as well as vegetable oils and fats (+4%). On the other hand, the export value of sugar and molasses (-9%) as well as grain mill products (+1%) was lower than the year before. Once more, the group of vegetable raw materials recorded a considerable growth of 13% in the export value of cereals. The balance of foreign trade in cereals was positive again, and in 2013, after many years, Poland became a net exporter of cereals. The proceeds from rapeseed exports increased by approx. one third, whilst there was a 44% decline in the export value of fresh fruit (-11%), mainly apples, fresh vegetables (-2%) and potatoes (-62%).
The first item in the category of other products, and simultaneously a commodity of the highest value in the material structure of total agri-food exports, was traditionally cigarettes: their export value grew by 11% over the year. There was also an increase in the re-exportation value of cocoa, coffee, tea and spices (+15%), exports of alcohol and alcoholic beverages (+14%), as well as waters and soft drinks (+17%).
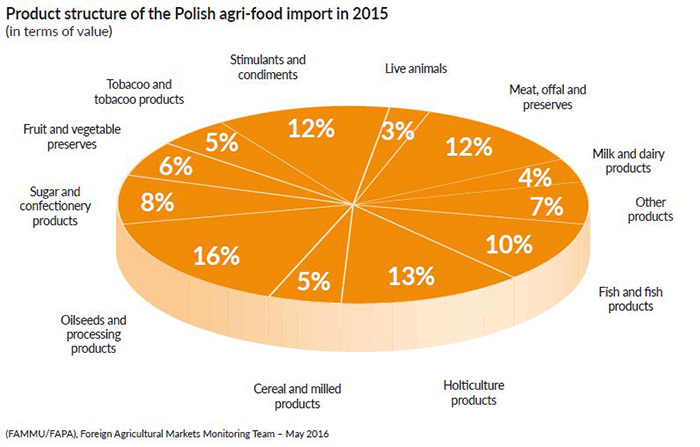
Imports of agri-food products to Poland in 2015 were traditionally dominated by low-processed products (47% of the value of supplies). Unprocessed goods had a 34% share in the purchase value, while the share of highly-processed goods was 20%. Over the year, the value of supplies of low-processed goods grew by 2%, of unprocessed ones - by 5%, and of highly-processed ones – by 10%.
Products of vegetable origin accounted for a half of the entire value of the agri-food imports. The cost of supplies of vegetable products increased by 4% in comparison with 2014. Among raw materials, there was a decline in the supply value of potatoes (-33%) and cereals (-9%). On the other hand, expenses were higher than the year before for imports of oilseed (+15%), fresh fruit (+7%) and vegetables (+8%). In the group of vegetable preparations, expenses declined in the imports of sugar and molasses (-29%), vegetable oils and fats (-6%) as well as oil meals and feed components (-1%). Conversely, there was an increase in the purchase of fruit preparations (+29%), starch, meal and malt (+13%), confectionery products (+12%), grain mill products (+5%) as well as vegetable preparations (+4%).
The category of animal products in 2015 had an approx. 30% share in the value of total imports of agri-food commodities. Over the year, the value of imports of animal products dropped by 2%.
The commodity with the highest value in purchases on foreign markets was pork again, with a 2% drop in expenses in comparison with 2014. In the animal category, less was also spent than the year before on the purchase of butter (-20%), milk, cream and ice cream (-3%), eggs and egg products (-8%), as well as meat preparations (-3%). On the other hand, there was an increase in value of beef imports (+32%), poultry meat (+18%), sheep and goat meat (+28%), horse meat (+128%), cheese and curd (+6%), animal fats and meal (+6%), as well as fish and fish products (+3%). In the group of live animals, pigs remain the most prominent imported item. However, the import value of these animals (mainly piglets) to Poland dropped by more than one fourth on the annual scale. Expenses on the purchase of cattle (+6%), horses (+10%) and live poultry (+4%) were higher than the previous year.
In the category of other products, the largest share in the value of imports (approx. 40%) traditionally comprised coffee, tea, cocoa and spices. In relation to 2014, expenses on these goods grew by 22%. There was a renewed growth in the purchase value of unprocessed tobacco for the production of cigarettes (+26%), alcohol and alcoholic beverages (+13%), as well as waters and soft drinks (+20%).
Geographic structure of the agri-food trade
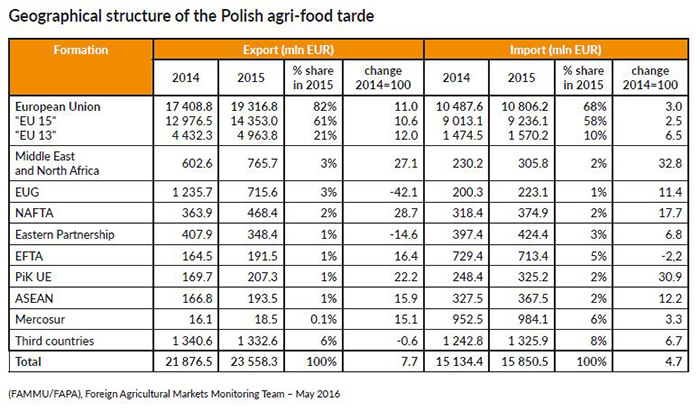
In 2015, the countries of the European Union were traditionally Poland’s most important partner in the agri-food trade. The balance of trade with this group increased by almost 23% due to the growth dynamics of exports being higher than of imports. The largest positive balance of agri-food trade with all countries was recorded in Germany, and the largest deficit – in Norway and Argentina.
In 2015, agri-food products worth more than EUR 19.3 billion were exported from Poland to the European Union countries, with a value 11% higher than the previous year, constituting an 82% share in the total Polish agri-food exports. In comparison with 2014, the share of the EU increased by 2 pp. The value of goods sent to the countries of the “old” EU-15 had a 55% share in total exports, and those exported to the new member states (EU-13), 19%. Once again, 2015 saw a positive balance of agri-food trade with the EU – it amounted to EUR 8.5 billion and was 23% higher than in 2014. The trade balance improved due to the growth dynamics of the value of exports (+11%) being higher than of agri-food imports from this group (+3%). Goods brought to Poland from all EU states had a value of approx. EUR 10.8 billion, accounting for a 68% share in the total Polish agri-food imports. The value of the goods imported from the “EU-15” comprised 58% of the total value of imports of these products, and in the case of goods imported from the “EU-13”, the share was 10%.

The value of food sales to the EU-15 was approx. EUR 13 billion, over 8.5% more than the previous year. The amount of products imported from this direction exceeded EUR 9.2 billion and was 2.5% higher on the annual scale. This was similar with new member states: the value of exports in 2015 grew by 10% to EUR 4.4 billion, whereas import expenses grew by 6.5% to approx. EUR 1.6 billion. A positive balance of trade with the states of the EU-15 was EUR 3.7 billion, having increased by as much as 27% over the year. A positive balance of trade with the states of the EU-13 amounted to EUR 2.9 billion, being 12% higher than in 2014.
Taking the commodity structure into consideration, the main goods exported from Poland to the EU were processed vegetable products – worth approx. EUR 5.9 billion, with a 30% share in the total value of agri-food exports to the EU market, as well as processed animal products – EUR 5.4 billion (a 28% share). Major export items included: confectionery products – EUR 2.3 billion (a 12% share), cigarettes – EUR 2.1 billion (11%), red meat – EUR 1.9 billion (10%), poultry meat – EUR 1.5 billion (8%), as well as fish and crustaceans – EUR 1 billion (5%). The largest share in imports of agri-food products from the EU comprised processed vegetable products – EUR 3.5 billion (32%), and processed animal products – EUR 2.4 billion (22%). The value structure of imports was dominated by red meat – EUR 1.4 billion (a 13% share), confectionery products – EUR 1.1 billion (10%), fresh fruit – EUR 658 thousand (6%), coffee, cocoa, tea and spices – EUR 655 thousand (6%), as well as vegetable oils and fats – EUR 0.61 billion (6%).
Recipients of Polish agri-food goods
The most important recipient of Polish agri-food products has traditionally been Germany. In 2015, Germany purchased products in Poland worth EUR 5.29 billion, accounting for 22% of the total Polish agri-food exports and 27% of exports to all EU states. In comparison with 2014, the value of goods supplied from Poland to the German market increased by 7%. The highest receipts were achieved from exporting smoked fish and fish preparations (EUR 490 million), poultry meat (EUR 392 million), bakery products (EUR 274 million), rapeseed (EUR 271 million) and chocolate (EUR 222 million) to Germany.
The second most valuable outlet was the United Kingdom with an amount of approx. EUR 2 billion and a share of 9% in total Polish agri-food exports and 10% in exports to EU countries. In 2015, the value of agri-food products exported in this direction was 18% higher. The main goods imported from Poland by the British included chocolate products (EUR 298 million), poultry meat (EUR 224 million), meat preparations (EUR 141 million), and bakery products (EUR 104 million).
The leading recipients of Polish agri-food goods also included the Czech Republic (EUR 1.61 billion, an increase by 18% on the annual scale), France (EUR 1.48 billion, a 1% decline), Italy (EUR 1.39 billion, +14%) and the Netherlands (EUR 1.33 billion, +22%). The main Czech expenses for purchases in Poland were connected with coffee, rapeseed oil, poultry meat and chocolate products. On our market, the French were predominantly procuring cigarettes, poultry meat and spirit-based beverages, the Italians – cigarettes, beef, pork and smoked fish, and the Dutch - cigarettes, beef, poultry meat and chocolate products. The highest growth dynamics of exports to the EU states in value terms was recorded by Malta (+64%), Croatia (+29%), Cyprus (+27%) and Greece (+25%). France was the only EU country for which we recorded a decline in agri-food exports in 2015. A negative trade balance only occurred in the case of Spain (EUR -315 million), Denmark (EUR -205 million) and Belgium (EUR -33 million).
The second group of countries, with a 3% share in the Polish agri-food exports, included the Middle East and North Africa. In this group, most receipts were gained on exports to Saudi Arabia, Egypt, Algeria and Israel. Exports to Arab countries were dominated by wheat. A large share in the value of exports to the Saudi market was also held by bakery and confectionery products as well as cheese and curd. Algeria also supplied itself on the Polish market with powdered milk and processed tobacco, and Egypt with cheese and curd, chocolate products and apples. In exports to Israel, sugar, sweetened waters and chocolate products were predominant.
The following recipients of agri-food products from Poland in 2015 were the countries of the Eurasian Economic Union (EAEU) – comprising Russia, Belarus, Kazakhstan, Armenia and Kyrgyzstan. In the structure of exports to the EAEU, the main commodities were fresh fruit, mainly apples (16%), confectionery products (16%), and vegetable preparations (12%). The value of exports to the EAEU reached EUR 715.6 million and was 42% lower than in 2014, mainly due to a decline in exports to Russia (-55%, to EUR 398 million). The most important items supplied to the Russian market were chocolate products, bakery products, frozen vegetables and fruit juices. The share of Russia in the total Polish exports of agri-food products was only 2%, dropping by 4 pp on the annual scale. However, we still recorded a positive balance of agri-food trade with this country, amounting to EUR 219 million, even though it has decreased by 70% in comparison with 2014. Due to the embargo on foodstuffs, in force since August 2014, the exports of Polish fruit and vegetables, red and poultry meat, as well as dairy products to Russia dropped to almost zero, whilst exports of meat preparations, fish preparations, as well as fruit and vegetable preparations declined as well. On the other hand, supplies of sugar, rapeseed, cereals and mill products rose. Exports of confectionery products dropped by 17%, however, they have remained at a high level. In 2015, the value of Polish agri-food exports to Belarus declined by 14% to EUR 234 million, and the commodity structure was dominated by apples, milk, fresh tomatoes and frozen vegetables.
The next group in exports of agri-food products from Poland in the previous year was the NAFTA (the United States, Canada and Mexico). The value of exports amounted to EUR 468.4 million, i.e. 29% more than the previous year. Exports in this direction accounted for approx. 3% of exports in value terms. The USA imported Polish goods worth EUR 362.5 million, 27% more than in 2014, mainly pork, meat preparations, confectionery products, alcoholic beverages, fruit juices, as well as fish and fish preparations. Canadians mainly imported confectionery products and pork from Poland.
The Eastern Partnership, comprising Ukraine, Moldova, Azerbaijan and Georgia, are the next group of countries importing Polish agri-food products. In 2015, the value of sales to these countries declined by 15% on the annual scale to EUR 348.4 million. The main items in the export structure were: fresh fruit, confectionery products, coffee, cocoa, tea and spices, as well as vegetable preparations. In 2015, we sent goods worth approx. EUR 298 million to Ukraine, 17% lower than the year before, predominantly animal feed, citrus fruits, chicks and apples.
In 2015, the Polish agri-food exports to the EFTA countries amounted to EUR 202.8 million, 15% more than in 2014, and the commodity structure was dominated by confectionery products, fruit preparations, tea, and fish fillets. The value of exports of agri-food goods from Poland to EU candidate countries grew by 24% to EUR 196 million. Exports to Turkey increased by 28% and comprised predominantly malt, beef and confectionery products. Of other countries, not aligned with any group, the largest recipients of Polish agri-food products were Hong Kong and China, mainly supplied with Polish poultry meat.
suppliers of Polish agri-food products
For many years, the most important supplier of agri-food products to Poland has been the European Union, with a value of imports in 2015 reaching EUR 10.81 billion, accounting for a 68% share in global imports in value terms. In comparison with 2014, the value of supplies grew by 3%. The states of the EU-15 exported agri-food products worth EUR 9.24 billion to Poland, 2.5% more on the annual scale, comprising a 58% share. Imports from the new member states, the EU-13, had a 10% share, and the value of purchases reached EUR 1.57 billion, being 7% higher than the previous year. In the commodity structure of supplies from the EU-15, the main commodity was pork (a 13% share), followed by chocolate products, animal feed, pigs, bakery products, citrus fruits, vegetable oils and powdered milk. Exports by new member states to the Polish market included mainly animal feed, chocolate products, cereals, malt and powdered milk.
Germany has been the largest supplier of agri-food products to Poland for many years. In 2015, the value of products imported from this country grew by 2% to EUR 3.42 billion, comprising a 22% share in total Polish agri-food imports and a 32% share in imports from the EU countries. The supplies were dominated by confectionery products (a 15% share in the value of imports from this country), coffee, cocoa, spices (11%), pork (10%), animal feed (7%), dairy products (7%), vegetable oils and fats (6%), and fresh fruit (4%).
As in the previous years, Poland’s second largest market for procurement of agri-food products in 2015 was the Netherlands, where goods worth EUR 1.27 billion were purchased – 1% more than the previous year. The largest shares in the commodity structure of supplies were plants, seedlings and flowers (18%), vegetable oils and fats (14%), pork (10%), cocoa, coffee, spices (9%), dairy products (7%) and fresh vegetables (6%).
The third largest exporter of agri-food products to Poland in the previous year was Spain, where we procured goods worth EUR 827 million, 5% more than in 2014. Spain has been traditionally supplying the Polish market with fresh citrus and other fruit (35% of the value of imports from this country), fresh vegetables (22%), as well as fruit and vegetable preparations (6%). Besides horticultural products, our imports from Spain included a lot of pork (a 14% share in the value of supplies) and wine (3%).
The fourth largest supplier of agri-food products to the Polish market in 2015, and simultaneously the largest one among third countries, was Norway. Imports from this country declined by 3% over the year, to EUR 680 million, and the products imported from this country were almost exclusively fish (99% of the value). Next in the lead of exporters to Poland included Italy (EUR 670.3 million, a 5% increase compared to 2014) and Denmark (EUR 670 million, -4%). Italy mainly supplied our market with confectionery products (18%), fresh fruit, particularly grapes (17%), wines (6%) and pasta (5%). Supplies from Denmark were dominated by pigs, mainly piglets (30%), pork (28%) and fish (12%).
Another third country importing to Poland in 2015, Argentina, had a decrease in the value of the exported products by 4% to EUR 572.8 million. Approx. 83% of the value of imports from this country comprised soybean meal, an essential component for the production of industrial feed; other commodities were peanuts (6%), citrus fruits (4%) and maize (3%). The largest deficit was recorded in agri-food trade with Norway and Argentina (EUR -578 and -571 million, respectively).
In the group of third countries, other major markets supplying agri-food products included Ukraine (EUR 382.6 million, +6% annually), the USA (EUR 314.6 million, +22%) and China (EUR 314.4 million, +2%). The imports from Ukraine were dominated by sunflower meal (20%), vegetable oils (13%), fruit and vegetable juices (6%) as well as rapeseed (6%). Products imported from the USA included mainly fish (17%), soybean meal (14%), tobacco (13%) and wine (9%). The Chinese sent predominantly fish (32%) and processed vegetables (17%) to Poland, followed by animal intestines, bladders and stomachs (9%) and honey (5%).
For many years, Germany has been Poland’s most important trade partner, both in terms of exports and imports. In 2015, sales to the German market grew by 11% year-on-year to € 48.5 billion, whereas imports grew by 8% to € 40 billion. In both cases, the growth dynamics was higher than in total trade. Germany’s share in the Polish trade with regards to imports and exports increased by 1 pp each, to 27% and 23%, respectively. Among the top ten largest outlets in terms of value, Russia (a 3% share) was the only non-EU country. In the case of imports, the top ten largest suppliers included three third countries: China (12%, the second most important supplier), Russia (a 7% share) and the USA (3%). Trade with the top ten partners constituted 66% of both total exports and imports. It is worth noting a high dynamics of trade with the USA: exports increased by 11% and imports by 14%, making it come 12th in the geographical structure of exports and 9th in imports.
2015 brought a minimal growth of the share of agri-food products to the total Polish foreign trade, whereas the growth rate of exports was comparable to that of total trade, and in the case of imports it was higher. The share of exports remained unchanged year-on-year, amounting to 13.2%, and the share of imports grew by 0.1 pp to 9.1%. The dynamics of in the changes of the share of food trade, in total trade, has undergone minimal changes in recent years. In 2015, the export of food increased 0.6 pp faster than the year before, and the growth dynamics of imports was 1.0 pp lower year-on-year. The balance of trade in foodstuffs has been positive for years, and in 2015, it increased dynamically, by 14.3% to € 7.708 billion. The results of the Polish foreign trade in food were affected by exports to the CIS (-34% y/y), including, above all, to Russia (-55%) and Ukraine (-17%), as a result of the Russo-Ukrainian conflict, the Russian embargo on EU foods (selected products) and the strong depreciation of the rouble and hryvnia. The share of the CIS countries in the geographical structure of Polish food exports dropped by 3 pp in 2015, from 8% to 5%.
Commodity structure of the agri-food trade
In 2015, the positive balance of the Polish agri-food trade increased by 14% annually to approx. EUR 7.7 billion. The trade balance in the categories of vegetable and animal preparations as well as vegetable raw materials greatly improved. In the animal category, there was mainly growth in the export value of poultry and poultry preparations, beef, eggs, as well as fish and fish preparations. The negative balance of trade in live animals improved due to a considerable decline in the imports of pigs. The export of cereals, rapeseed, starch, meal and malt, confectionery products, fruit and vegetable preparations, as well as vegetable oils and fats increased. Simultaneously, imports of cereals declined. On the other hand, lower receipts were observed on the export of fresh fruit and vegetables, considering higher expenditures on foreign purchases. A positive balance of trade in sugar rose noticeably due to a drop in imports. The positive balance of trade in stimulants slightly decreased.
The Polish agri-food exports in 2015 were dominated by low-processed products, accounting for 56% of their value. Highly-processed goods had a 25% share, and unprocessed products accounted for 19%. Compared to 2014, the share of highly-processed products in total exports increased by 1 pp at the expense of low-processed ones. The value of exports grew by 12% for highly-processed goods, by 6% for low-processed goods, and by 7% for unprocessed products.
In 2015, in the animal category, the positive balance of trade in red meat increased by more than half, mainly due to growth, by one fourth, in proceeds from beef exports. The export value of horse meat (+7%) as well as sheep and goat meat (+22%) was also higher than the year before, with a decline in exports of pork (-1%). The positive balance of trade in poultry meat grew by 20%, due to a further growth in the value of exports (+20%). There was also an increase in receipts from the foreign sales of meat preparations (+7%), fish and fish preparations (+3%), as well as eggs and egg preparations (+19%). On the other hand, the value of sales was lower than the previous year in the case of live animals (-2%), mainly pigs and cattle, as well as dairy products: milk (-18%), cheese and curd (-11%), and butter (-2%).
In the vegetable category, as in the previous years, the most important role in exports was played by processed products; their export value in 2015 grew by 10%. This group saw an increase in receipts from the sales of starch, meal and malt (+32%), confectionery products (+15%), sauces, soups and thickeners (+10%), fruit and vegetable preparations (+5%), oil meals, feed components and feeds (+4%), as well as vegetable oils and fats (+4%). On the other hand, the export value of sugar and molasses (-9%) as well as grain mill products (+1%) was lower than the year before. Once more, the group of vegetable raw materials recorded a considerable growth of 13% in the export value of cereals. The balance of foreign trade in cereals was positive again, and in 2013, after many years, Poland became a net exporter of cereals. The proceeds from rapeseed exports increased by approx. one third, whilst there was a 44% decline in the export value of fresh fruit (-11%), mainly apples, fresh vegetables (-2%) and potatoes (-62%).
The first item in the category of other products, and simultaneously a commodity of the highest value in the material structure of total agri-food exports, was traditionally cigarettes: their export value grew by 11% over the year. There was also an increase in the re-exportation value of cocoa, coffee, tea and spices (+15%), exports of alcohol and alcoholic beverages (+14%), as well as waters and soft drinks (+17%).
Imports of agri-food products to Poland in 2015 were traditionally dominated by low-processed products (47% of the value of supplies). Unprocessed goods had a 34% share in the purchase value, while the share of highly-processed goods was 20%. Over the year, the value of supplies of low-processed goods grew by 2%, of unprocessed ones - by 5%, and of highly-processed ones – by 10%.
Products of vegetable origin accounted for a half of the entire value of the agri-food imports. The cost of supplies of vegetable products increased by 4% in comparison with 2014. Among raw materials, there was a decline in the supply value of potatoes (-33%) and cereals (-9%). On the other hand, expenses were higher than the year before for imports of oilseed (+15%), fresh fruit (+7%) and vegetables (+8%). In the group of vegetable preparations, expenses declined in the imports of sugar and molasses (-29%), vegetable oils and fats (-6%) as well as oil meals and feed components (-1%). Conversely, there was an increase in the purchase of fruit preparations (+29%), starch, meal and malt (+13%), confectionery products (+12%), grain mill products (+5%) as well as vegetable preparations (+4%).
The category of animal products in 2015 had an approx. 30% share in the value of total imports of agri-food commodities. Over the year, the value of imports of animal products dropped by 2%.
The commodity with the highest value in purchases on foreign markets was pork again, with a 2% drop in expenses in comparison with 2014. In the animal category, less was also spent than the year before on the purchase of butter (-20%), milk, cream and ice cream (-3%), eggs and egg products (-8%), as well as meat preparations (-3%). On the other hand, there was an increase in value of beef imports (+32%), poultry meat (+18%), sheep and goat meat (+28%), horse meat (+128%), cheese and curd (+6%), animal fats and meal (+6%), as well as fish and fish products (+3%). In the group of live animals, pigs remain the most prominent imported item. However, the import value of these animals (mainly piglets) to Poland dropped by more than one fourth on the annual scale. Expenses on the purchase of cattle (+6%), horses (+10%) and live poultry (+4%) were higher than the previous year.
In the category of other products, the largest share in the value of imports (approx. 40%) traditionally comprised coffee, tea, cocoa and spices. In relation to 2014, expenses on these goods grew by 22%. There was a renewed growth in the purchase value of unprocessed tobacco for the production of cigarettes (+26%), alcohol and alcoholic beverages (+13%), as well as waters and soft drinks (+20%).
Geographic structure of the agri-food trade
In 2015, the countries of the European Union were traditionally Poland’s most important partner in the agri-food trade. The balance of trade with this group increased by almost 23% due to the growth dynamics of exports being higher than of imports. The largest positive balance of agri-food trade with all countries was recorded in Germany, and the largest deficit – in Norway and Argentina.
In 2015, agri-food products worth more than EUR 19.3 billion were exported from Poland to the European Union countries, with a value 11% higher than the previous year, constituting an 82% share in the total Polish agri-food exports. In comparison with 2014, the share of the EU increased by 2 pp. The value of goods sent to the countries of the “old” EU-15 had a 55% share in total exports, and those exported to the new member states (EU-13), 19%. Once again, 2015 saw a positive balance of agri-food trade with the EU – it amounted to EUR 8.5 billion and was 23% higher than in 2014. The trade balance improved due to the growth dynamics of the value of exports (+11%) being higher than of agri-food imports from this group (+3%). Goods brought to Poland from all EU states had a value of approx. EUR 10.8 billion, accounting for a 68% share in the total Polish agri-food imports. The value of the goods imported from the “EU-15” comprised 58% of the total value of imports of these products, and in the case of goods imported from the “EU-13”, the share was 10%.
The value of food sales to the EU-15 was approx. EUR 13 billion, over 8.5% more than the previous year. The amount of products imported from this direction exceeded EUR 9.2 billion and was 2.5% higher on the annual scale. This was similar with new member states: the value of exports in 2015 grew by 10% to EUR 4.4 billion, whereas import expenses grew by 6.5% to approx. EUR 1.6 billion. A positive balance of trade with the states of the EU-15 was EUR 3.7 billion, having increased by as much as 27% over the year. A positive balance of trade with the states of the EU-13 amounted to EUR 2.9 billion, being 12% higher than in 2014.
Taking the commodity structure into consideration, the main goods exported from Poland to the EU were processed vegetable products – worth approx. EUR 5.9 billion, with a 30% share in the total value of agri-food exports to the EU market, as well as processed animal products – EUR 5.4 billion (a 28% share). Major export items included: confectionery products – EUR 2.3 billion (a 12% share), cigarettes – EUR 2.1 billion (11%), red meat – EUR 1.9 billion (10%), poultry meat – EUR 1.5 billion (8%), as well as fish and crustaceans – EUR 1 billion (5%). The largest share in imports of agri-food products from the EU comprised processed vegetable products – EUR 3.5 billion (32%), and processed animal products – EUR 2.4 billion (22%). The value structure of imports was dominated by red meat – EUR 1.4 billion (a 13% share), confectionery products – EUR 1.1 billion (10%), fresh fruit – EUR 658 thousand (6%), coffee, cocoa, tea and spices – EUR 655 thousand (6%), as well as vegetable oils and fats – EUR 0.61 billion (6%).
Recipients of Polish agri-food goods
The most important recipient of Polish agri-food products has traditionally been Germany. In 2015, Germany purchased products in Poland worth EUR 5.29 billion, accounting for 22% of the total Polish agri-food exports and 27% of exports to all EU states. In comparison with 2014, the value of goods supplied from Poland to the German market increased by 7%. The highest receipts were achieved from exporting smoked fish and fish preparations (EUR 490 million), poultry meat (EUR 392 million), bakery products (EUR 274 million), rapeseed (EUR 271 million) and chocolate (EUR 222 million) to Germany.
The second most valuable outlet was the United Kingdom with an amount of approx. EUR 2 billion and a share of 9% in total Polish agri-food exports and 10% in exports to EU countries. In 2015, the value of agri-food products exported in this direction was 18% higher. The main goods imported from Poland by the British included chocolate products (EUR 298 million), poultry meat (EUR 224 million), meat preparations (EUR 141 million), and bakery products (EUR 104 million).
The leading recipients of Polish agri-food goods also included the Czech Republic (EUR 1.61 billion, an increase by 18% on the annual scale), France (EUR 1.48 billion, a 1% decline), Italy (EUR 1.39 billion, +14%) and the Netherlands (EUR 1.33 billion, +22%). The main Czech expenses for purchases in Poland were connected with coffee, rapeseed oil, poultry meat and chocolate products. On our market, the French were predominantly procuring cigarettes, poultry meat and spirit-based beverages, the Italians – cigarettes, beef, pork and smoked fish, and the Dutch - cigarettes, beef, poultry meat and chocolate products. The highest growth dynamics of exports to the EU states in value terms was recorded by Malta (+64%), Croatia (+29%), Cyprus (+27%) and Greece (+25%). France was the only EU country for which we recorded a decline in agri-food exports in 2015. A negative trade balance only occurred in the case of Spain (EUR -315 million), Denmark (EUR -205 million) and Belgium (EUR -33 million).
The second group of countries, with a 3% share in the Polish agri-food exports, included the Middle East and North Africa. In this group, most receipts were gained on exports to Saudi Arabia, Egypt, Algeria and Israel. Exports to Arab countries were dominated by wheat. A large share in the value of exports to the Saudi market was also held by bakery and confectionery products as well as cheese and curd. Algeria also supplied itself on the Polish market with powdered milk and processed tobacco, and Egypt with cheese and curd, chocolate products and apples. In exports to Israel, sugar, sweetened waters and chocolate products were predominant.
The following recipients of agri-food products from Poland in 2015 were the countries of the Eurasian Economic Union (EAEU) – comprising Russia, Belarus, Kazakhstan, Armenia and Kyrgyzstan. In the structure of exports to the EAEU, the main commodities were fresh fruit, mainly apples (16%), confectionery products (16%), and vegetable preparations (12%). The value of exports to the EAEU reached EUR 715.6 million and was 42% lower than in 2014, mainly due to a decline in exports to Russia (-55%, to EUR 398 million). The most important items supplied to the Russian market were chocolate products, bakery products, frozen vegetables and fruit juices. The share of Russia in the total Polish exports of agri-food products was only 2%, dropping by 4 pp on the annual scale. However, we still recorded a positive balance of agri-food trade with this country, amounting to EUR 219 million, even though it has decreased by 70% in comparison with 2014. Due to the embargo on foodstuffs, in force since August 2014, the exports of Polish fruit and vegetables, red and poultry meat, as well as dairy products to Russia dropped to almost zero, whilst exports of meat preparations, fish preparations, as well as fruit and vegetable preparations declined as well. On the other hand, supplies of sugar, rapeseed, cereals and mill products rose. Exports of confectionery products dropped by 17%, however, they have remained at a high level. In 2015, the value of Polish agri-food exports to Belarus declined by 14% to EUR 234 million, and the commodity structure was dominated by apples, milk, fresh tomatoes and frozen vegetables.
The next group in exports of agri-food products from Poland in the previous year was the NAFTA (the United States, Canada and Mexico). The value of exports amounted to EUR 468.4 million, i.e. 29% more than the previous year. Exports in this direction accounted for approx. 3% of exports in value terms. The USA imported Polish goods worth EUR 362.5 million, 27% more than in 2014, mainly pork, meat preparations, confectionery products, alcoholic beverages, fruit juices, as well as fish and fish preparations. Canadians mainly imported confectionery products and pork from Poland.
The Eastern Partnership, comprising Ukraine, Moldova, Azerbaijan and Georgia, are the next group of countries importing Polish agri-food products. In 2015, the value of sales to these countries declined by 15% on the annual scale to EUR 348.4 million. The main items in the export structure were: fresh fruit, confectionery products, coffee, cocoa, tea and spices, as well as vegetable preparations. In 2015, we sent goods worth approx. EUR 298 million to Ukraine, 17% lower than the year before, predominantly animal feed, citrus fruits, chicks and apples.
In 2015, the Polish agri-food exports to the EFTA countries amounted to EUR 202.8 million, 15% more than in 2014, and the commodity structure was dominated by confectionery products, fruit preparations, tea, and fish fillets. The value of exports of agri-food goods from Poland to EU candidate countries grew by 24% to EUR 196 million. Exports to Turkey increased by 28% and comprised predominantly malt, beef and confectionery products. Of other countries, not aligned with any group, the largest recipients of Polish agri-food products were Hong Kong and China, mainly supplied with Polish poultry meat.
suppliers of Polish agri-food products
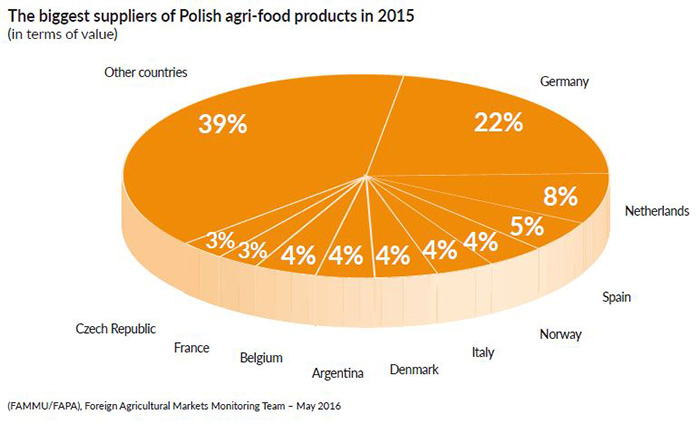
For many years, the most important supplier of agri-food products to Poland has been the European Union, with a value of imports in 2015 reaching EUR 10.81 billion, accounting for a 68% share in global imports in value terms. In comparison with 2014, the value of supplies grew by 3%. The states of the EU-15 exported agri-food products worth EUR 9.24 billion to Poland, 2.5% more on the annual scale, comprising a 58% share. Imports from the new member states, the EU-13, had a 10% share, and the value of purchases reached EUR 1.57 billion, being 7% higher than the previous year. In the commodity structure of supplies from the EU-15, the main commodity was pork (a 13% share), followed by chocolate products, animal feed, pigs, bakery products, citrus fruits, vegetable oils and powdered milk. Exports by new member states to the Polish market included mainly animal feed, chocolate products, cereals, malt and powdered milk.
Germany has been the largest supplier of agri-food products to Poland for many years. In 2015, the value of products imported from this country grew by 2% to EUR 3.42 billion, comprising a 22% share in total Polish agri-food imports and a 32% share in imports from the EU countries. The supplies were dominated by confectionery products (a 15% share in the value of imports from this country), coffee, cocoa, spices (11%), pork (10%), animal feed (7%), dairy products (7%), vegetable oils and fats (6%), and fresh fruit (4%).
As in the previous years, Poland’s second largest market for procurement of agri-food products in 2015 was the Netherlands, where goods worth EUR 1.27 billion were purchased – 1% more than the previous year. The largest shares in the commodity structure of supplies were plants, seedlings and flowers (18%), vegetable oils and fats (14%), pork (10%), cocoa, coffee, spices (9%), dairy products (7%) and fresh vegetables (6%).
The third largest exporter of agri-food products to Poland in the previous year was Spain, where we procured goods worth EUR 827 million, 5% more than in 2014. Spain has been traditionally supplying the Polish market with fresh citrus and other fruit (35% of the value of imports from this country), fresh vegetables (22%), as well as fruit and vegetable preparations (6%). Besides horticultural products, our imports from Spain included a lot of pork (a 14% share in the value of supplies) and wine (3%).
The fourth largest supplier of agri-food products to the Polish market in 2015, and simultaneously the largest one among third countries, was Norway. Imports from this country declined by 3% over the year, to EUR 680 million, and the products imported from this country were almost exclusively fish (99% of the value). Next in the lead of exporters to Poland included Italy (EUR 670.3 million, a 5% increase compared to 2014) and Denmark (EUR 670 million, -4%). Italy mainly supplied our market with confectionery products (18%), fresh fruit, particularly grapes (17%), wines (6%) and pasta (5%). Supplies from Denmark were dominated by pigs, mainly piglets (30%), pork (28%) and fish (12%).
Another third country importing to Poland in 2015, Argentina, had a decrease in the value of the exported products by 4% to EUR 572.8 million. Approx. 83% of the value of imports from this country comprised soybean meal, an essential component for the production of industrial feed; other commodities were peanuts (6%), citrus fruits (4%) and maize (3%). The largest deficit was recorded in agri-food trade with Norway and Argentina (EUR -578 and -571 million, respectively).
In the group of third countries, other major markets supplying agri-food products included Ukraine (EUR 382.6 million, +6% annually), the USA (EUR 314.6 million, +22%) and China (EUR 314.4 million, +2%). The imports from Ukraine were dominated by sunflower meal (20%), vegetable oils (13%), fruit and vegetable juices (6%) as well as rapeseed (6%). Products imported from the USA included mainly fish (17%), soybean meal (14%), tobacco (13%) and wine (9%). The Chinese sent predominantly fish (32%) and processed vegetables (17%) to Poland, followed by animal intestines, bladders and stomachs (9%) and honey (5%).


