

Despite the growth dynamics of imports being higher than of exports (as is clearly visible in value terms), a positive trade balance increased year-on-year, impacted by a base effect. The positive trade balance amounted to € 882.7 (+9.9%) and 160.9 thousand tons (+9.3%). The average value of exports in 2015 grew by 1.9%, and as for imports, it grew even quicker, namely, by 4%.
In terms of volume, 74.3% of the imports of sweets comprised chocolate products, while in terms of value, their share was 3.5 pp higher. On the other hand, in the case of exports of sweets, chocolate products comprised 80% of the volume and 81.3% of value.
78.5% of sweet exports in volume terms and 74.4% in value terms reached the EU. The share of EU countries rose by 4.1 pp year-on-year. Other important outlets were third countries (19.2% of exports), including the CIS (4.1%) and NAFTA (3.3%). In 2015, the United Kingdom remained the main recipient of Polish sweets, receiving 22.9% of our exports. The British purchased 21.4% more sweets from Poland. Germany came second (a 14.4% share), and the Netherlands third (6.8%). Among third countries, the lowest two ranks in the top ten were occupied by Russia (2.6%) and Saudi Arabia (2.3%). The purchase of goods by the Dutch doubled, while the Russian purchases dropped by ¼. Exports to the top ten comprised 68.8% of total exports in volume terms and 66.4% in value terms.
As in the previous years, sweets in 2015 were purchased primarily in the EU, accounting for 92.7% of the imports of these products. However, the share of the EU declined by 2.8 pp year-on-year, whilst third countries gained in significance, particularly Ivory Coast, Ukraine and Russia. The main supplier remained Germany, where 38.5% of the imported sweets were purchased. Large quantities were also bought in Belgium and Italy (8% each). The top ten only included one non-EU country, namely, the aforementioned Ivory Coast (a three-and-a-half increase in purchases), the world’s greatest producer of cocoa beans. The top ten accounted for 85.3% of imported sweets (in value terms, this share was 0.9 pp higher).
In the period under analysis, the volume of exports of goods bearing the codes CN 1704 and 1806 accounted for 33.7% of the volume (31.4% the year before) and 86.7% of the value (84.1% the previous year) of exports of the commodity group comprising sugar, products of the sugar industry and confectionery products. In total agri-food exports, sweets comprised 1.7% in terms of volume (1.6% in 2014) and 6.9% in value (6.6% the previous year).
The share of sweets in imports of the commodity group comprising sugar, products of the sugar industry and confectionery products, in the period under analysis, was 36.5% in terms of volume (28.4% the year before) and 81.7% in value (73.3% in 2014). On the other hand, imports of sweets comprised a 0.8% share (0.9% the year before) in total imports of agri-food products in terms of volume and 4.7% in value (4.3% the year before).

(FAMMU/FAPA), Foreign Agricultural Markets Monitoring Team – May 2016
(FAMMU/FAPA), Foreign Agricultural Markets Monitoring Team – May 2016
*in the country where harvested
An increase in the share of sweets in sugar and confectionery exports predominantly results, beside intensified exports of these products, from a drop in the export of sugar. In the case of imports, a significant role was played, apart from an increase in imports of total sweets, by a strong declines in the purchas of sugar and syrups.
Compared to the results of trade in sugar and confectionery products, sweets fared much better than the entire group. Their exports rose very dynamically, both in terms of value (+12.3% compared to +9%) and volume (+10.2% compared to 3%). On the other hand, imports recorded a high positive dynamics of volume (+10.9%) despite a strong decline in the entire group (-13.8%), and in terms of value, purchases of sweets rose by 15.4% compared to a 3.6% growth in the entire group.
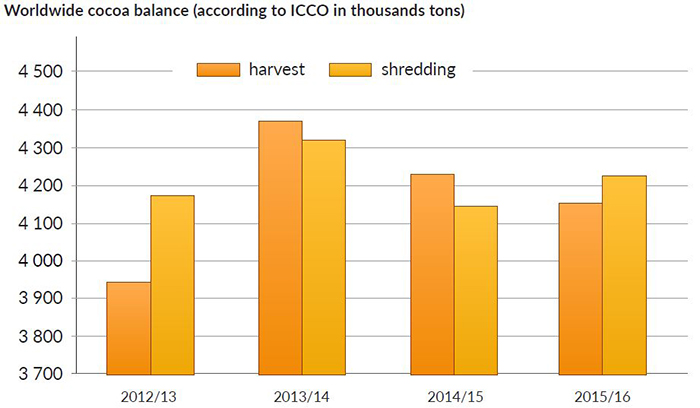
In the first quarter of 2016, the milling of beans in Europe declined by 0.2% year-on-year, whilst throughout 2015, a growth by 1.7% was observed. The data for 2015 are better than initially assumed. The results from the first quarter of 2016 should not cause much concern about the demand for beans and products that contain them.
The International Cocoa Organization (ICCO) predicts that the season 2015/16 on the worldwide cocoa market will close with a deficit of 113 thousand tons. Simultaneously, it was stated that the season of 2014/15 eventually closed with a surplus of 42 thousand tons, although a slight deficit had been expected earlier. The ICCO predicts that the harvest of beans will decline by 1.8% year-on-year to 4.154 million tons, and milling will rise by 1.9% to 4.225 million tons. In the previous season, a drop by 3.2 and 4.1%, respectively, had been recorded. Stock, on the other hand, will decline by 7% to 1.494 million tons, to comprise 35.4% of meal (3.4 pp less year-on-year). Such a low share has not been recorded for many years.
The main reason for lower harvests is its drop by 6% in Ivory Coast, the world’s largest cocoa producer. In 2015, average monthly quotations of cocoa according to ICCO increased by 13.1% year-on-year to USD 2916.4/t. The quotations of cocoa on the New York commodity exchange increased over 2015 (end of December on end of December) by 11% to USD 3215/t, and on the London exchange, by 15% to GBP 2246/t. These quotations have been the highest in 4-5 years.
CONFECTIONERY NOT CONTAINING COCOA
Confectionery not containing cocoa includes: chewing gum, liquorice extract, white chocolate, pastilles including throat pastilles, sugar-coated confectionery, gum and jelly confectionery, boiled sweets whether filled or not, toffees, caramels, confectionery in the form of compressed tablets, and other products, not mentioned above.
The volume of exports of confectionery products not containing cocoa, in 2015, increased by 3.6% to nearly 74 thousand tons. The value of exported goods rose more dynamically, i.e. by 10.5% to EUR 304.8 million (EUR 276 million in 2014). At the same time, 53.4 thousand tons of these products were brought to Poland (growth by 4% from 51.4 thousand tons) for EUR 165.4 million, i.e. 5% more in relation to EUR 157.6 million in 2014. As a result, the positive trade balance rose by 17.8% to EUR 139.5 million (compared to EUR 118.4 million previously). With regard to volume, a surplus of 20.6 thousand tons was recorded, and the balance increased by 2.8% from 20 thousand tons. A much more dynamic growth in the value of exports than of imports resulted in a surplus much higher than the year before. In terms of volume, a similar growth rate of imports and exports made the excess in exports, obtained in the previous years, improve the positive trade balance.

(FAMMU/FAPA), Foreign Agricultural Markets Monitoring Team – May 2016
(FAMMU/FAPA), Foreign Agricultural Markets Monitoring Team – May 2016
In 2015, export profitability improved, and the average value of exports rose by 6.6% year-on-year. Imports were more expensive as well, but their growth dynamics were much lower than of exports, amounting to 1%. In 2015, the growth rate of exports was more than twice as high as the previous year, while in the case of imports, it only increased by 0.2 pp.
The most important outlets for Polish confectionery not containing cocoa remained the EU countries, where 66.1% of exports were sent (64.1% in value terms). Exports to the EU gained in significance, and the share grew by 1.6 pp year-on-year (a drop by 0.7 pp in value terms). The significance of the CIS declined, but other third countries became more important. This situation was caused by intensified exports to Saudi Arabia and United Arab Emirates (+23% y/y) and a reduction in sales to Russia (-10.4% y/y). The CIS received 7.1% of the exports, other third countries received 24.8%, including NAFTA - 4% (Canada and the USA).
The main recipient of Polish sweets without cocoa in 2015 was Germany, accounting for a 21.4% share in terms of volume. Exports to Germany rose by 1.4%. It was followed, with significantly lower shares, by the United Kingdom (+80.8% y/y) and Saudi Arabia (+2%). The share of these countries in the geographic structure of exports was 7.5 and 7.1%, respectively.
In 2015, the main export goods were commodities falling under the code CN 1704 90 99 (a 32.4% share). Toffees and caramels (CN code: 1704 90 75) came second with a 25.3% share. Large quantities of boiled sweets, including filled sweets, were also sold abroad (CN 1704 90 71 – a 14.6% share).
In the period under analysis, the export of confectionery not containing cocoa accounted for 6.7% in terms of volume and 16.2% in terms of value in the exports of the group of commodities comprising sugar, products in the sugar industry and confectionery products. In 2014, this share was 6.7% and 16.0%, respectively. On the other hand, in 2015, the export of confectionery not containing cocoa comprised 1.3% (1.3% the previous year as well) in terms of the value of total agri-food exports and 0.3% in terms of quantity (0.3% the previous year as well).
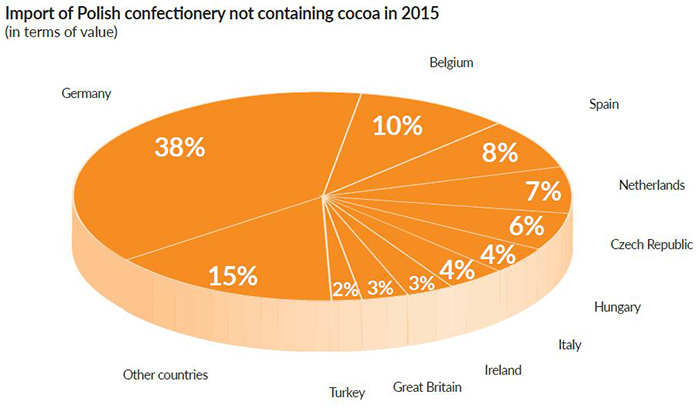
The main suppliers of products bearing the code CN 1704 to the Polish market include the EU countries, accounting for 89% of these products (90.7% in terms of value). Contrary to the changes in the geographic structure of exports, the significance of the EU in imports dropped (by 1.9 pp in volume terms and 0.6 pp in value terms), whilst the CIS gained on importance, mainly due to purchases from Ukraine being eight times higher (a 4.4% share).
In 2015, as in the previous years, confectionery not containing cocoa was procured, above all, in Germany – 17.4 thousand tons worth EUR 62 million, comprising a 32.6% share in terms of volume. The volume of imports from this country rose by 5.3%, and the value by 13.1%. Other large suppliers included Belgium (a 11.9% share), the Czech Republic (a 9.3% share) and the Netherlands (a 8.5% share).
Imports of commodities in this group, 26.7%, comprised other gum and jelly confectionery, including fruit pastes in the form of sugar confectionery (CN 1704 90 65). Other eagerly purchased products included sugar-coated goods (code: CN 1704 90 61 – a 13.4% share), toffees, caramels and similar sweets (CN 1704 90 75), and CN 1704 90 30 (a 12.2% share for both) as well as boiled sweets, whether filled or not (CN 1704 90 71 – a 11.1% share).
In 2015, imports of confectionery not containing cocoa were 1.0% (a 1.0% share in 2014 as well) in terms of value and 0.2% (0.2% the year before as well) of the value of total imports of agri-food products. In imports, the share of the group of commodities comprising sugar, products of the sugar industry and confectionery products for the period under analysis was 9.4% (7.8% the year before) in volume and 18.2% (17.9% in 2014) of the value of imports in this group.
(FAMMU/FAPA), Foreign Agricultural Markets Monitoring Team – May 2016
CHOCOLATE PRODUCTS
As in the previous years, among the commodity groups analyzed in this chapter, chocolate products (confectionery containing cocoa) were the most valuable item of Polish exports and imports of the sugar and confectionery industries. In 2015, the Polish foreign trade in these products closed with a positive balance of EUR 743.2 million, rising by 8.5% year-on-year from EUR 684.8 million in 2014 (EUR 633.1 million in 2013). In terms of volume, the positive balance increased even more dynamically, by 10.3% to 140.4 thousand tons (compared to 127.2 thousand tons the year before and 131.3 thousand tons in 2013). After the drop in volume, recorded in 2014, the positive balance was noticeably restored above the 2013 level. This resulted from a renewed increase in interest in Polish chocolates in the United Kingdom.
295.2 thousand tons of these products were exported in 2015, gaining EUR 1321.8 million (in 2014, 263.5 thousand for EUR 1172.1 million). The volume of exports increased by 12%, and their value declined by 12.8%. At the same time, the volume of imports increased by 13.6% to 154.8 thousand tons, and the value was 18.7% higher, increasing to EUR 578.6 million (in 2014, 136.3 thousand tons for EUR 487.3 million).
The growth dynamics of exports was lower than of imports, but the high excess of exports over imports enabled an increase in the positive balance. In 2015, the average value of exports rose by 0.7% year-on-year, and as for imports, it was 4.5% higher. The year before, prices in chocolate foreign sales rose on average by 7.8%, and purchases by 4.9%. In the context of a strong drop in the growth dynamics of the value of exports, one can talk about a deterioration of export profitability in 2015.
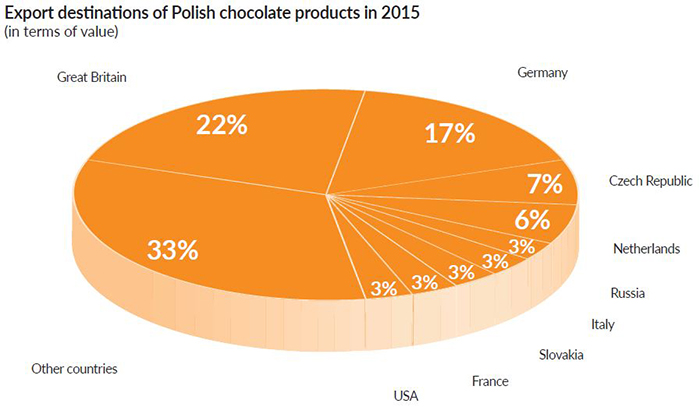
The main recipients of Polish chocolates were the EU countries, and their share in the commodity structure in 2015 increased noticeably, by 4.5 pp, to 81.6% (+5.1 pp to 76.7% in value terms). Exports to the CIS and other third countries declined in significance. Most Polish confectionery containing cocoa reached the United Kingdom again – 79.2 thousand tons, for a value of EUR 298.1 million. This comprised a 26.8% share in exports in terms of volume. Thereby, exports to the British Isles recovered after a drop in 2015 and were higher than in 2014. Exports to the UK rose strongly year-on-year: by 18.6% in terms of volume, at a 24.3% increase in value. Other significant outlets were Germany (a 12.7% share), the Netherlands (exports doubled with a 7.9% share) and the Czech Republic (a 7% share). Exports to Russia dropped by 31.5% y/y, to the United Arab Emirates by 45.5%, to China by 58.1%, and to Ukraine by 32.5%.
In the commodity structure of exports, the predominance of other filled chocolates (CN 1806 90 31) was maintained, accounting for 21.5% of exports in terms of volume and 26.2% in terms of value. A significant role was also played by spreads containing cocoa (CN 1806 90 60) with a 14.1% share, chocolate products in blocks, slabs or bars (code: CN 1806 31 00), with a 11.2% share, and products with the code CN 1806 32 90 (other filled chocolate confectionery) had a 10.2% share.
In 2015, exports of chocolate products accounted for 70.4% (68.1% the previous year) in value and 26.9% (24.7% in 2014) in the volume of exports from the group of commodities comprising sugar, products of the sugar industry and confectionery products. The share in total exports of agri-food products comprised 1.3% in volume (1.5% the previous year) and 5.6% in value (5.4% the previous year).
Confectionery containing cocoa, in 2015, was mainly imported from the EU countries, accounting for 93.9% of the procured goods with the code CN 1806 (94.6% in terms of value). The importance of the EU declined by 3.3 pp year-on-year (3 pp in value terms). Third countries gained in significance. Purchases in Ivory Coast, the world’s largest cocoa producer, increased three and a half times to 6.4 thousand tons (worth € 21.6 million, i.e. nearly four and a half times more y/y), accounting for a 4.2% share in the geographic structure of imports (3.7% in value terms). Purchases in Russia and Ukraine also rose dynamically, yet they remained insignificant.
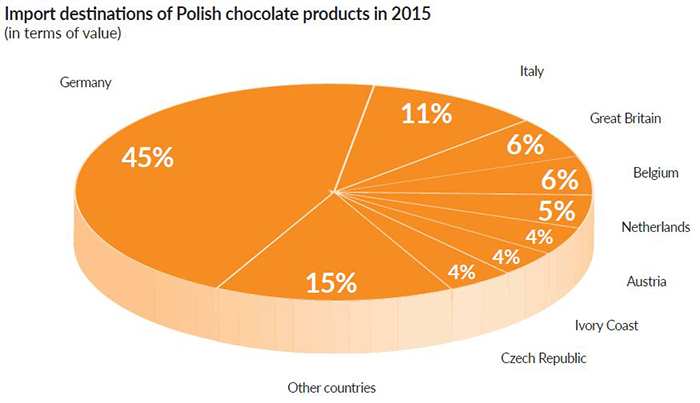
For many years, the main supplier of chocolate products to the Polish market has been Germany, where 62.8 thousand tons were purchased in 2015 for EUR 262 million. Imports rose by 0.9% in terms of volume and by 9.1% in terms of value. Imports from Germany accounted for 40.5% of all confectionery containing cocoa imported to Poland. Significantly smaller suppliers of chocolate products to the Polish market were: Italy (a 9.5% share), the United Kingdom (7.7%), the Netherlands (6.8%), and Belgium (6.6%).
The commodity structure of Polish imports of confectionery containing cocoa was dominated by other food preparations containing cocoa in blocks, slabs or bars, filled (CN 1806 31 00), imports of which comprised a 21.3% share (22.3% in terms of value). Significant products were other food preparations containing cocoa in blocks, slabs or bars, weighing more than 2 kg or in liquid, paste, powder, granular or other bulk form in containers or immediate packages, of a content exceeding 2 kg, containing 31% or more cocoa butter by weight or containing a combined weight of 31% or more of cocoa butter and milkfat (CN 1806 20 10), imports of which comprised a 13.3% share (11% in value terms), as well as goods falling under the code CN 1806 20 95 (other food preparations containing cocoa in blocks, slabs or bars, weighing more than 2 kg or in liquid, paste, powder, granular or other bulk form in containers or immediate packages, of a content exceeding 2 kg), which comprised 12.6% of imports (10.4% in value terms). They were followed by products with the code CN 1806 32 90 (other filled chocolate products) with a 10.6% share (9.8% in value terms).
In 2015, imports of chocolate products comprised 3.7% (3.2% in 2014) of the value and 0.6% (0.6% the previous year as well) of the volume in total imports of agri-food products. The share of the group of goods comprising sugar, products of the sugar industry and confectionery products in imports was 63.5% (55.4% the previous year) in terms of value and 27.1% (20.6% the previous year) with regard to volume.


